
How-to Methods Used to Acquire Sonar Imagery
Introduction
Once considered a by-product of multibeam surveys, the back-scattered acoustic intensity from the seafloor is now viewed as extremely useful in determining the physical properties of the sea bottom, e.g. roughness/smoothness, hardness/softness, mud, clay, sand, cobble, etc..
Various methods are employed in the collection of back-scattered intensities, which are separate processes from the bathymetric bottom detection process:
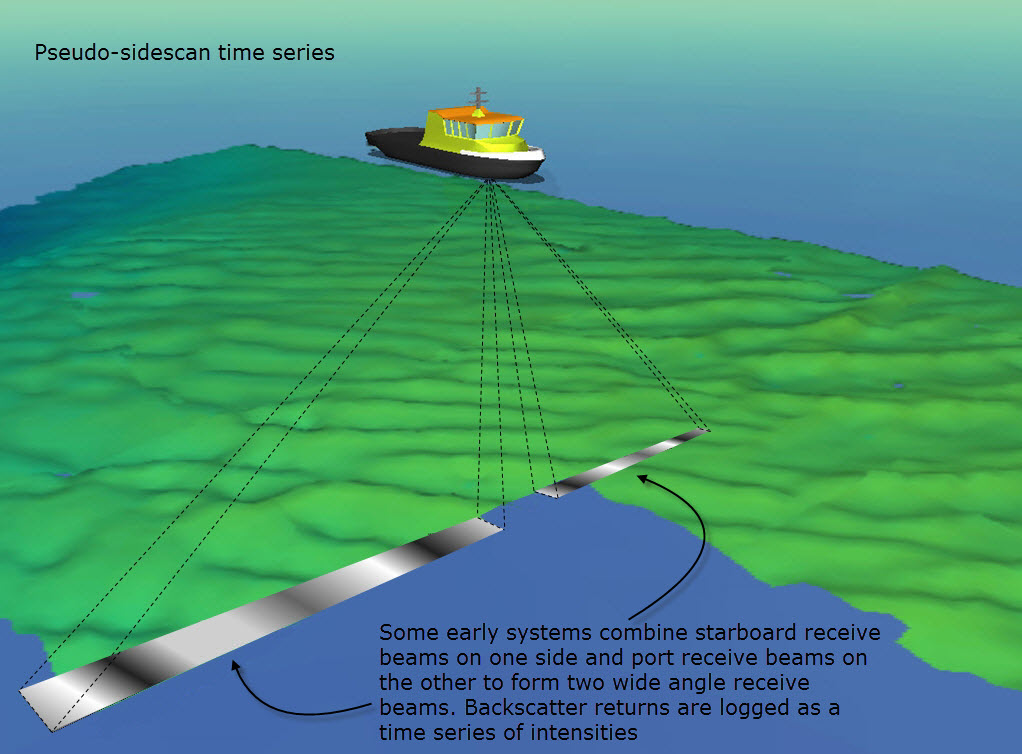
- Pseudo Sidescan time series: Two additional wide angle receive beams to port and starboard are formed that log a sidescan-like time series of intensities.
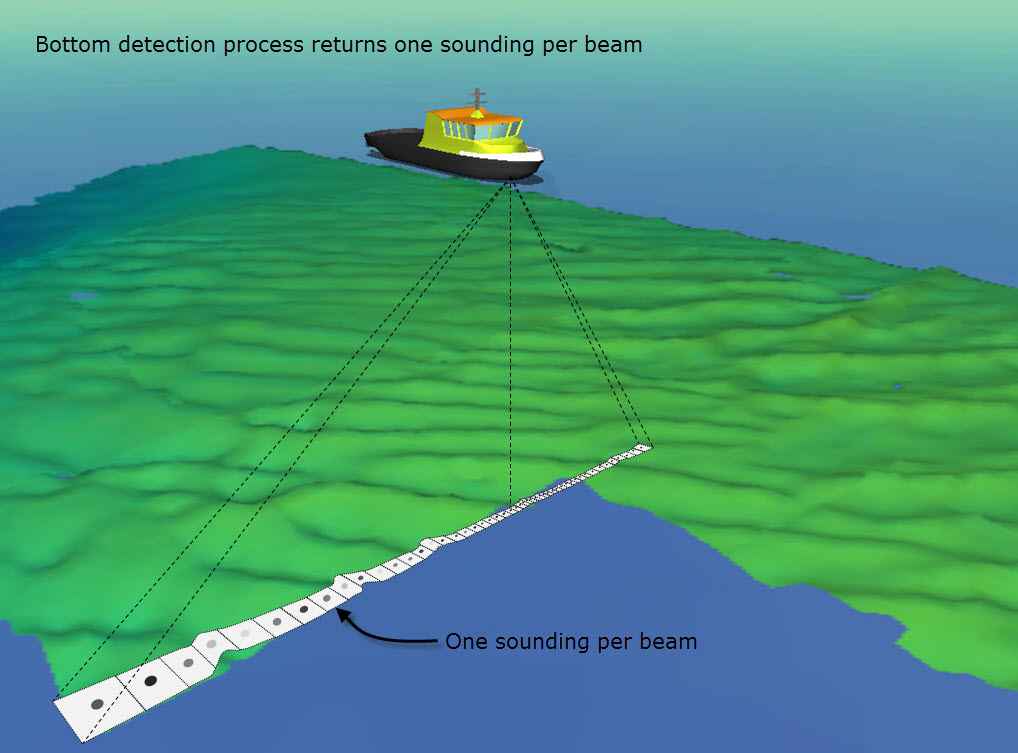
- Single value per beam: The beam footprint time-series is reduced to a single value; common approaches provide an average, maximum or simply report the amplitude value associated with the bottom detection sample number for each beam.
- Footprint time-series: A subset of the beam-formed output centered on the bottom detection
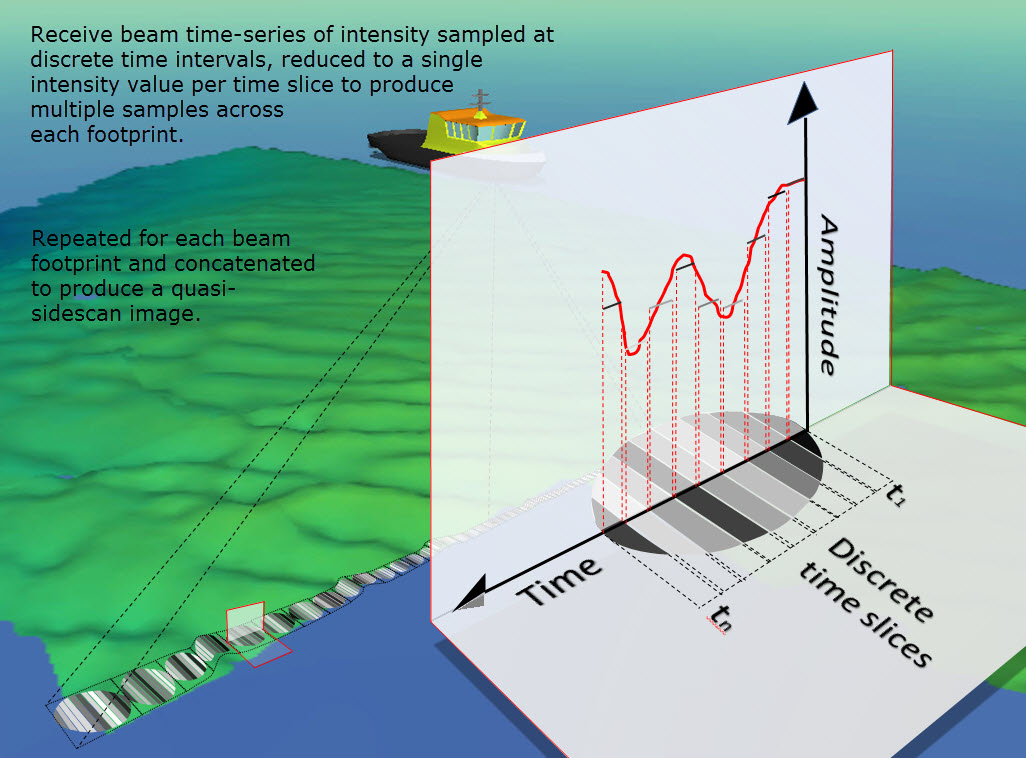
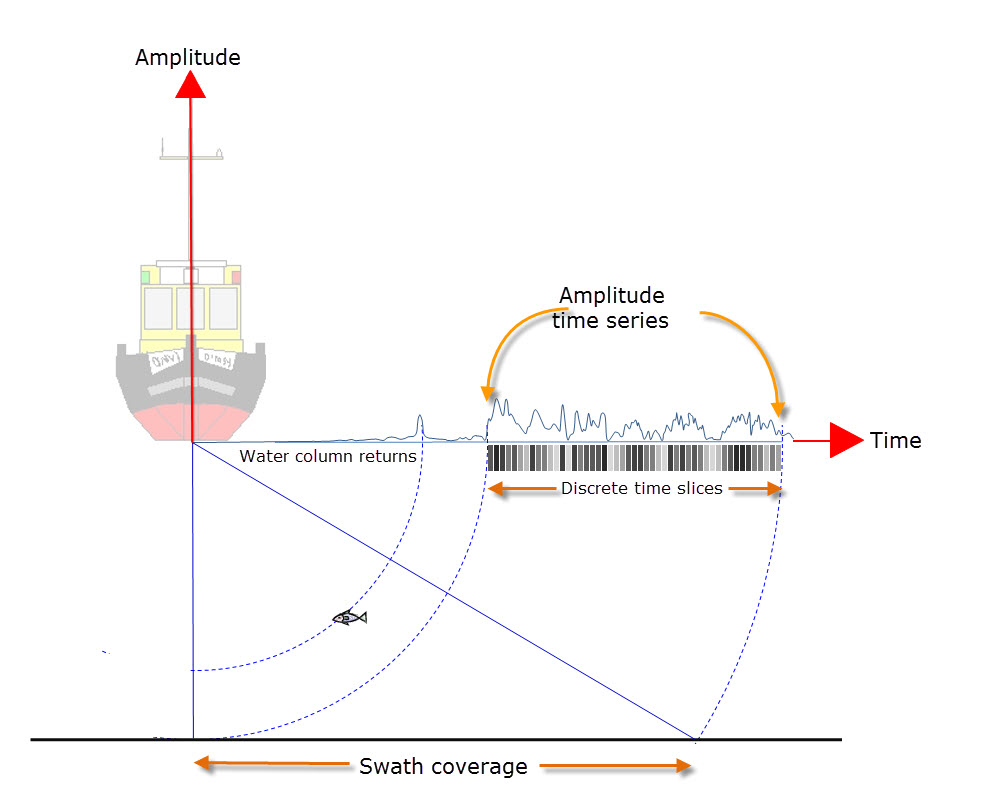
- Amplitude time-series: The beam footprint time-series of beams on either side of the swath are assembled into a single time-series that mimics the output of a sidescan.
- Amplitude/Angle time-series: A time-series of amplitudes and angles. This is the native output of phase measuring bathymetric sidescans but is also available with R2Sonic TruePix.
Most MBE systems currently on the market use one of the last four forms of imagery data.
Info
Note that all acoustic backscatter data must be radiometrically and geometrically corrected to some extent or other to yield useful information.
On this page:
Bottom Detection - Bathymetry
![]()
Pseudo Sidescan time series
Some early multibeam models combine 1) all the starboard and 2) all the port bathymetric ‘receive’ beams to form two additional wide angle receive beams, one to port and one starboard.
Backscatter returns are logged as a time series of intensities across each wide angle beam.
In this approach the two wide angle receive beams are completely independent of the bathymetry beams, meaning that the backscatter data is divorced from the bathymetric profile provided by the bottom detect solutions.
Without a bathymetric profile for reference, typically a flat bottom assumption is made to correct slant ranges to horizontal. Two major problems are associated with the flat-bottom assumption:
- Often the seabed is not flat, and
- The wide angle beam cannot differentiate between two echoes arriving simultaneously from two different directions.
Single value per beam
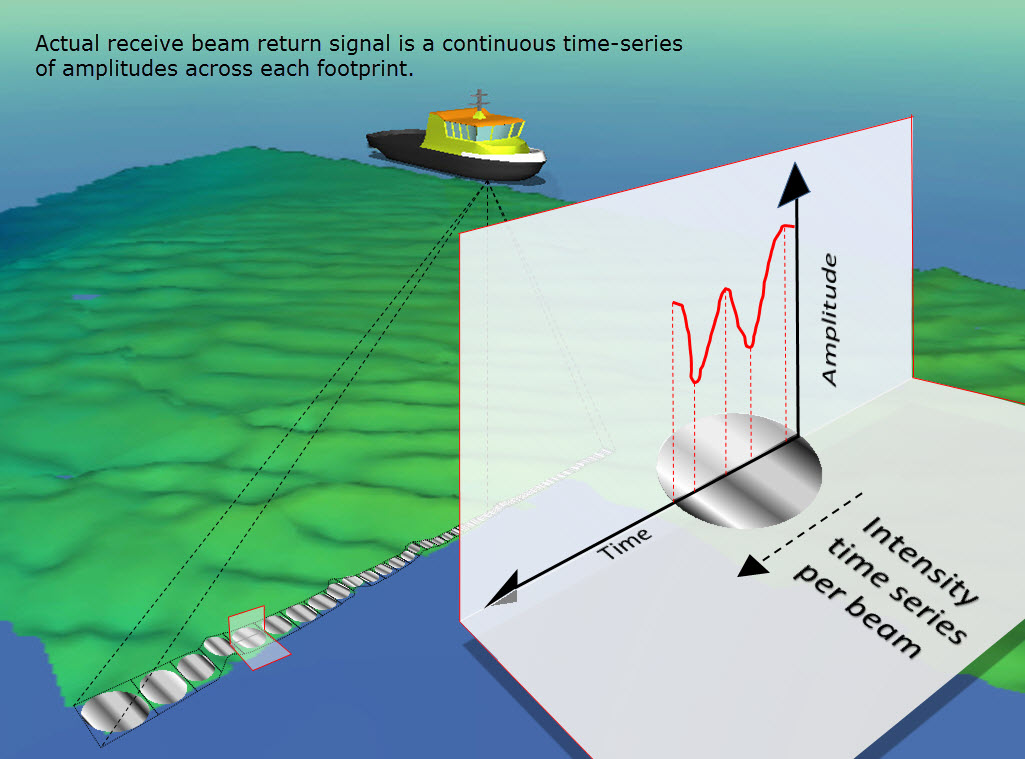
As indicated in the section on bathymetry bottom detection, the receive beam return signal is a continuous time-series of amplitudes created as the sound wave sweeps across each footprint. In one way or another, the beam time-series is reduced to a single representative intensity per beam which is geo-referenced using the positioned bottom detect point. The main drawback of this method is that potentially useful spatial information within each footprint area is discarded in the process of reducing the backscatter time-series surrounding the bottom detect of each beam to a single value.
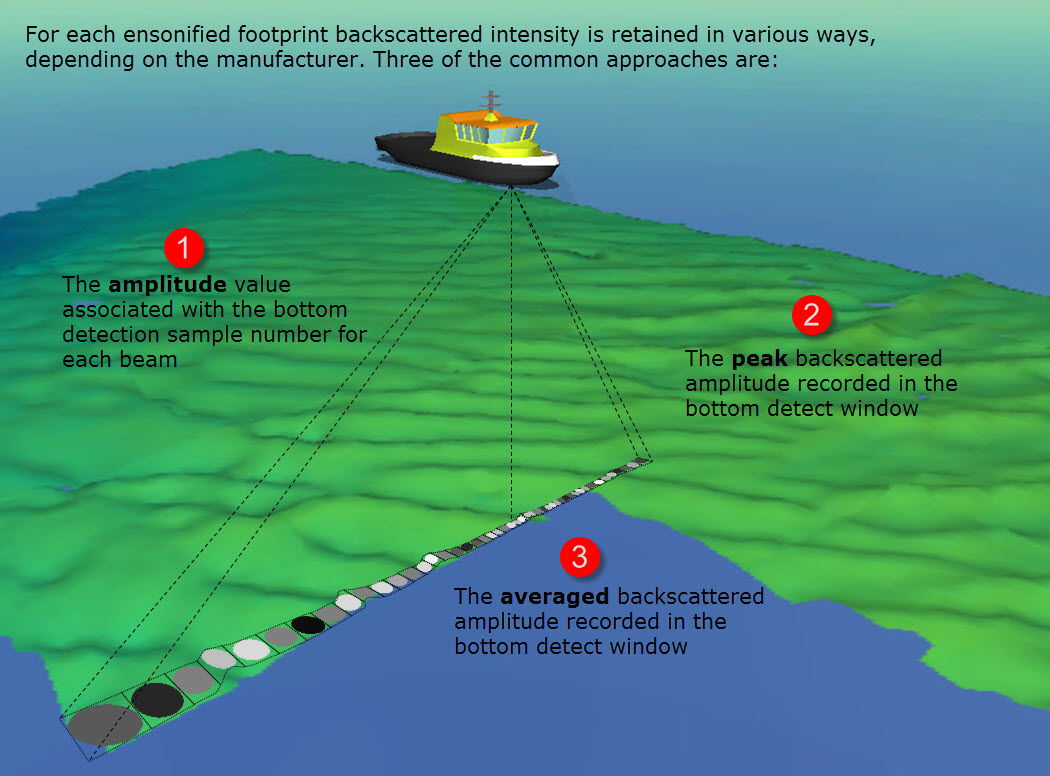
Note: From the time series associated with a beam footprint, method 1 reports the amplitude value in the time-series that occurs at the time associated with the bottom detection returned travel-time measurement.
Every modern multibeam system QPS has written interfacing drivers for provides a single value per beam (Kongsberg, Reson 8K/7K, R2Sonic, MB1, WASSP).
The single value is sometimes a peak value, an average value or a single sample plucked from the foot-print time-series associated with the bottom detection. The method varies varies by manufacturer and there are pros and cons associated with each..
Footprint time series
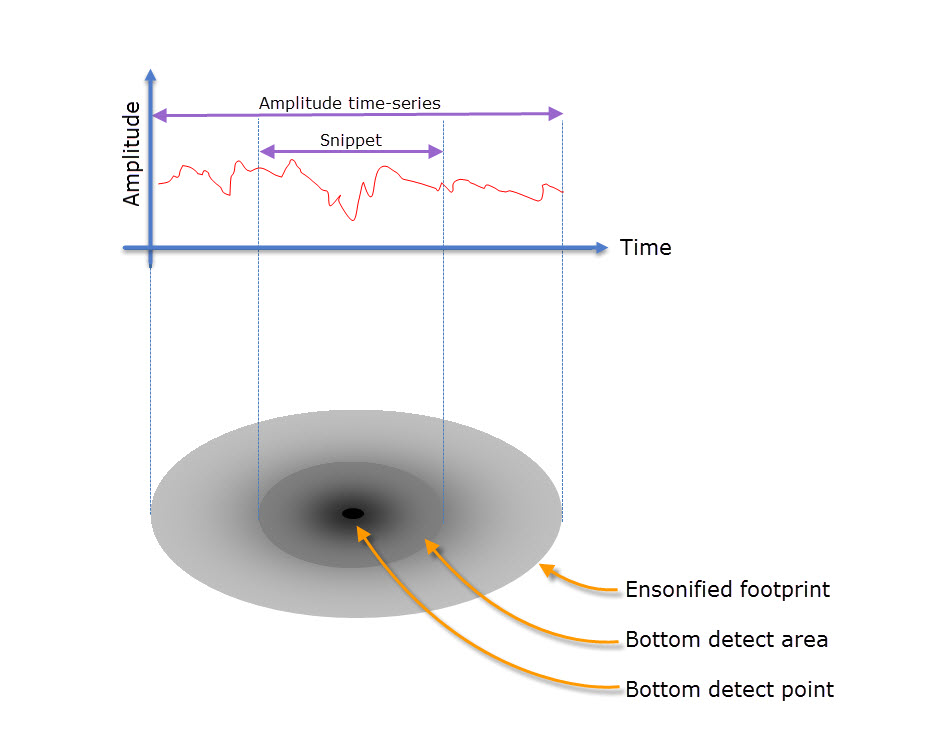
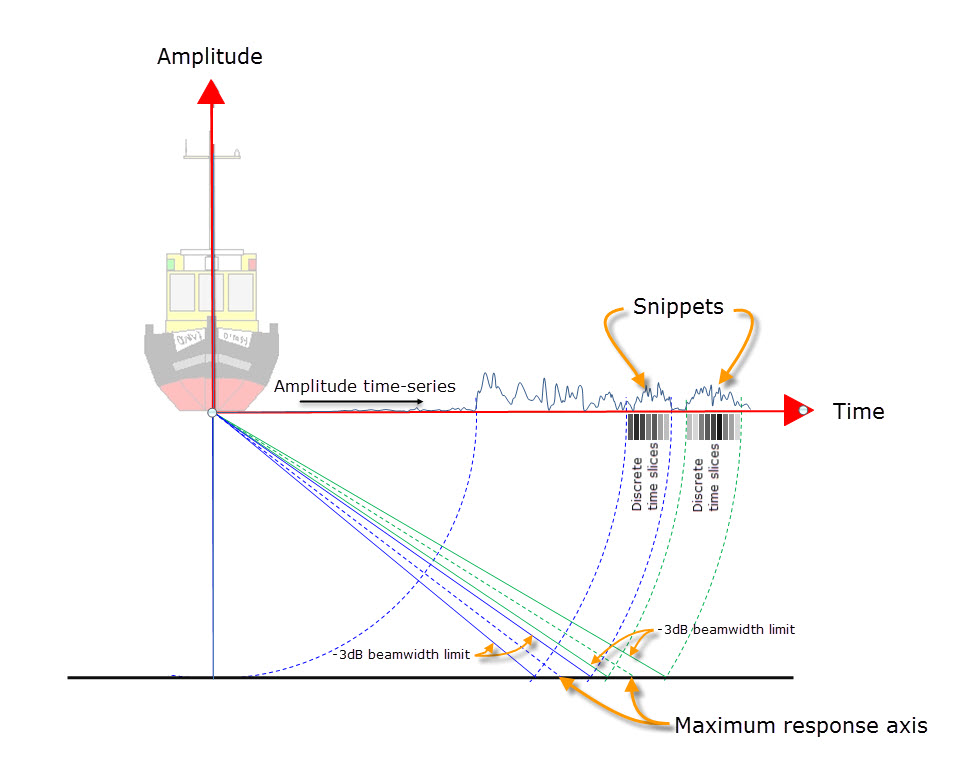
A footprint time-series (snippet) is a window of intensity values reflected from a beam‘s footprint on the seafloor, centered around the bottom detect point. One time-series is produced for each beam for each sonar ping. In addition to intensities, each Snippets data packet contains pertinent information such as time stamp, sequential ping number, sample rate, sound velocity and operator settings such as power, gain, absorption and range scale.
These 'snippets' of data are grabbed from that part of the ensonification used for bottom detect. A snippet is the amplitude time-series remaining after some unessential bits are thrown away from the bottom detection point (i.e. the water column reflections and the reverberation before and after the bottom detection). The length of each time-series varies as a function of the individual beam angle, seafloor depth, grazing angle and the time-series operating mode set in the multibeam. The strategy for determining the minimum number of samples to ensure overlap between adjacent beams varies from one manufacturer to another. If gaps occur between snippets due to preserving an insufficient number of samples, then data holidays can result in the mosaic in between receiver beam footprints.
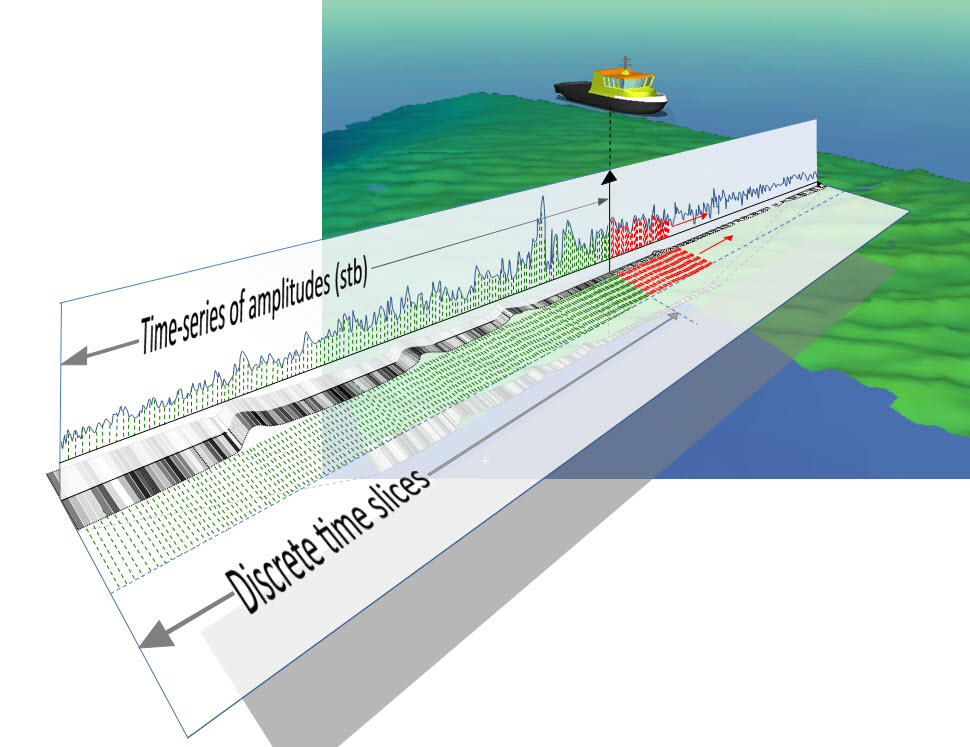
Each 'snippet' is diced into discrete time slices with a single intensity value derived for each slice. If all the snippets for the starboard beams are concatenated, and all the snippets for the port beams are concatenated, the two combined series will provide a result similar to slant range corrected sidescan imagery. Where footprint ensonification areas for adjacent beams overlap, intensities for each time slice within the overlap must be resolved using data from two snippets. Data volumes can grow quite large when all snippets are stored in the *.db files.
As a consequence of centering around the bottom detect point there is usually only a single angle, and therefore only one geographic point, associated with each footprint time-series. The snippet samples for a given receiver beam are generated as the sound arcs across the footprint and thus each sample technically can have a unique angle. This particular angular information is not preserved in any snippet data from any sensor that QPS is aware of, though it conceivably could be. In processing snippet data, Fledermaus Geocoder Tools (FMGT) uses the beam position information from adjacent beams to calculate what the angle for each snippet sample would be for the snippet samples in between the receiver beam footprint locations and each time slice ends up with its own associated geographical position.
The picture above is repeated below in a more diagrammatic fashion. It presents snippets for two beams as an illustration of what time slice sampling is performed on all beams.
The footprint time-series technique overcomes the weaknesses of the first two methods in that:
- The individual time-series are directly associated with a portion of the bathymetric profile and are therefore much easier to correct for slant-range
- Because a portion of the time series is preserved for each beam, more spatial information is available per ensonified footprint area. Across-track resolution of seafloor features derived from the backscatter is therefore greater than that provided by the bottom detect points.
- Any 'Layover' issues are restricted to the dimension of a single beam rather than the entire swath.
Derivation of the term 'snippets'
During 2001, Fugro Pelagos, Inc (FPI) worked closely with Reson Inc. and TritonElics Inc., to jointly add the capability to record the raw backscatter data from each beam for each ping of the Reson 8000 series systems. FPI referred to this as a “Snippet”; their proprietary terminology is Footprint Time Series (FTS).
Refer to: 'New Developments in Multi-beam Backscatter Data Collection and Processing' Lockhart, Saade and Wilson (Fugro Pelagos, Inc.).
Amplitude time series
Whereas snippets preserve only a portion of each ensonified footprint, i.e the -3dB envelope about the maximum response axis, an Amplitude Time Series is assembled by concatenating the intensity values across the entire ensonified footprint of each beam. This yields one time-series for all port beams and one for all starboard beams, thereby mimicking the output of a sidescan. The two amplitude time-series are again diced at discrete time intervals over the entire time-series to create discrete time slices, each of which yields an intensity value.
As with snippets, Fledermaus Geocoder Tools (FMGT) uses the beam position information from adjacent beams to calculate what the angle for each time slice sample would be. Each time slice ends up with its own associated geographical position.
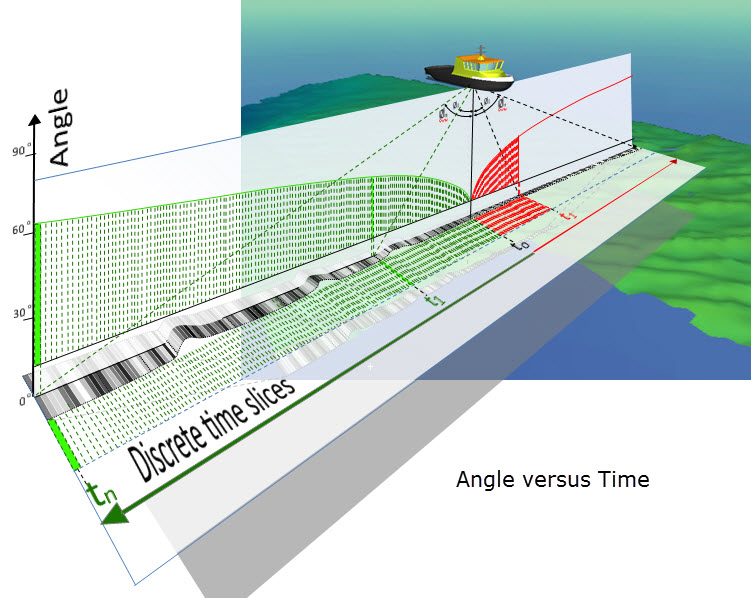
Amplitude/Angle time series
Beamforming Multibeam
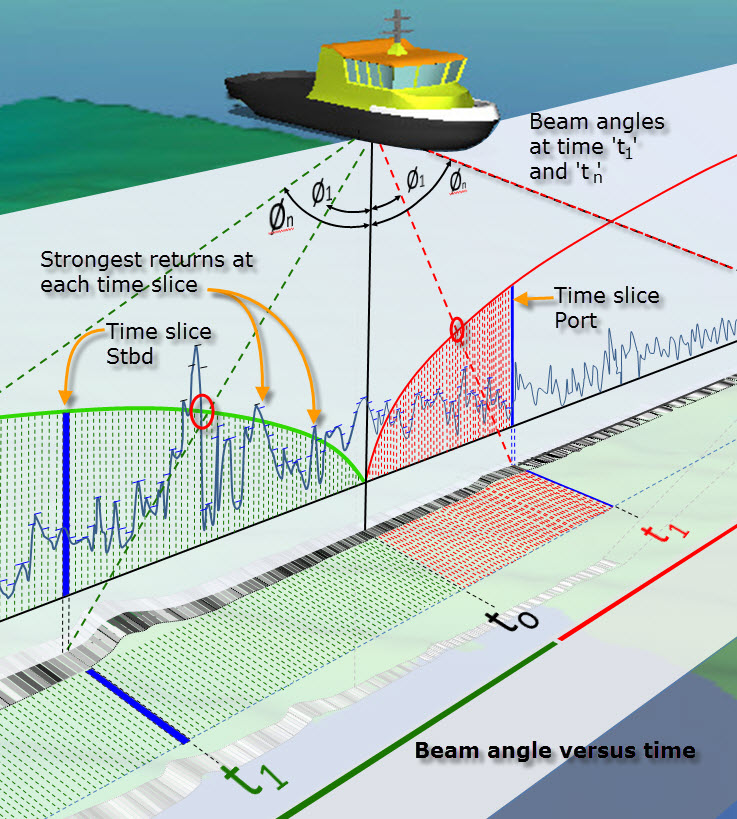
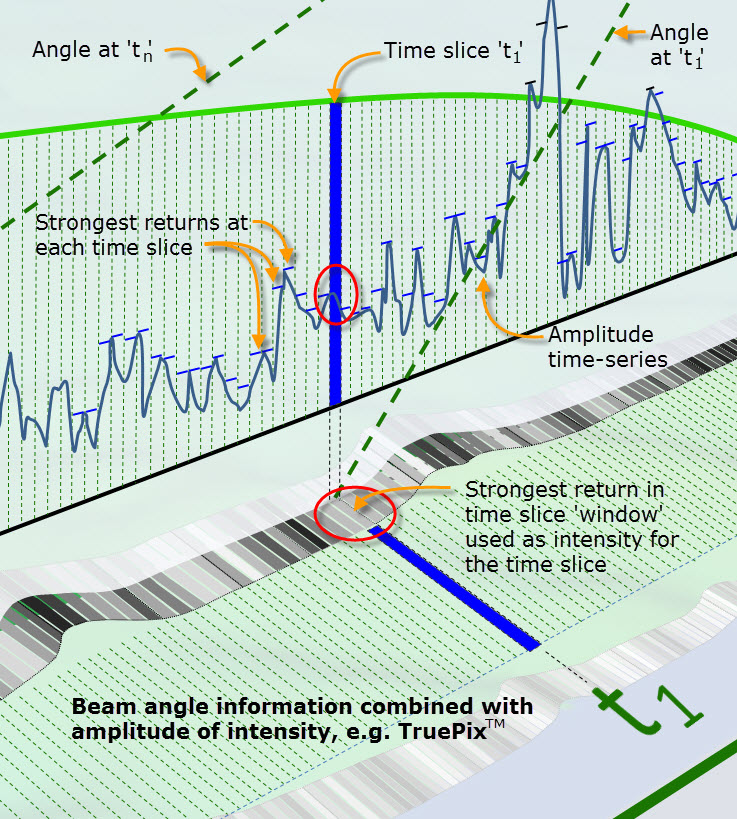
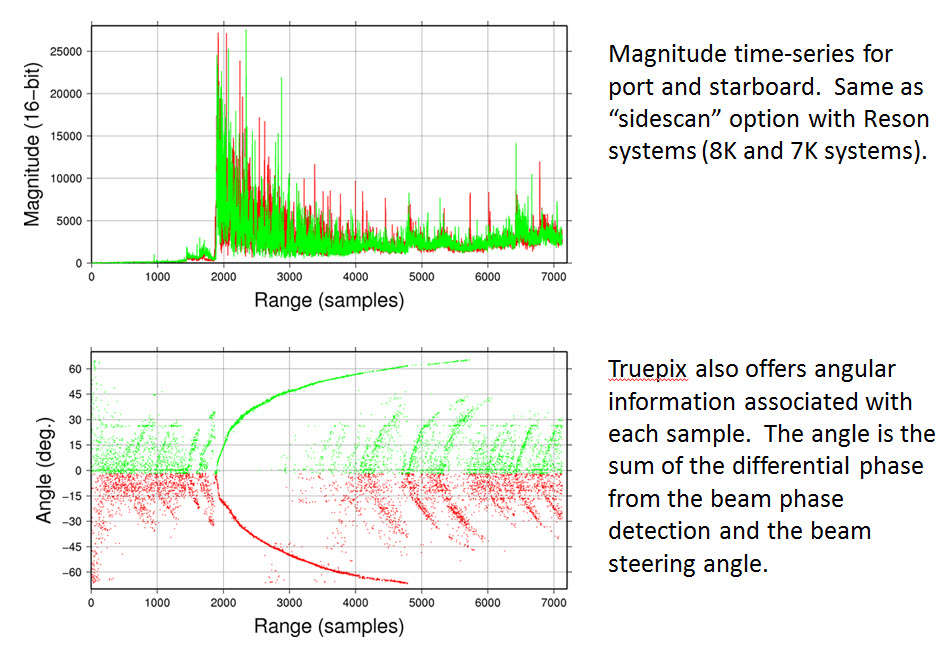
An Amplitude/Angle Time Series combines an amplitude time series as described above with angular information for each time slice. R2Sonic's TruePix™ is an example of this method.
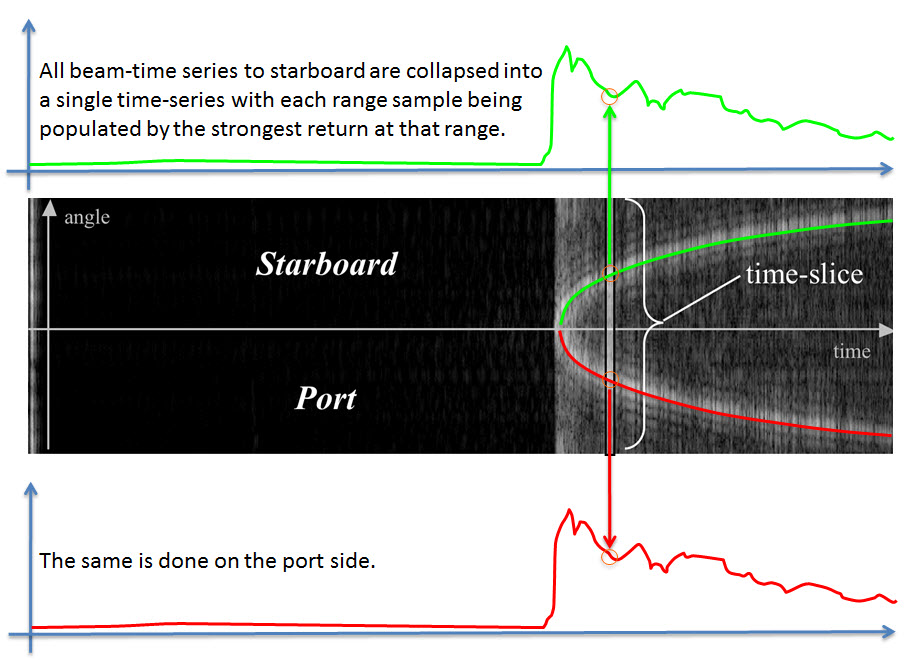
All beam-time series to starboard are collapsed into a single time-series with each range sample being populated by the strongest return at that range. The same is done on the port side.
TruePix™, - provides the equivalent of a sidescan trace but this is assembled from the receiver beam individual beam-formed outputs instead of forming a wide receive beam like a sidescan does.
Courtesy of John Hughes Clark (UNB) and Jonathan Beaudoin (formerly UNH, now with QPS) an alternative way to visualize the Time Versus Angle plot is shown in the following diagrams.
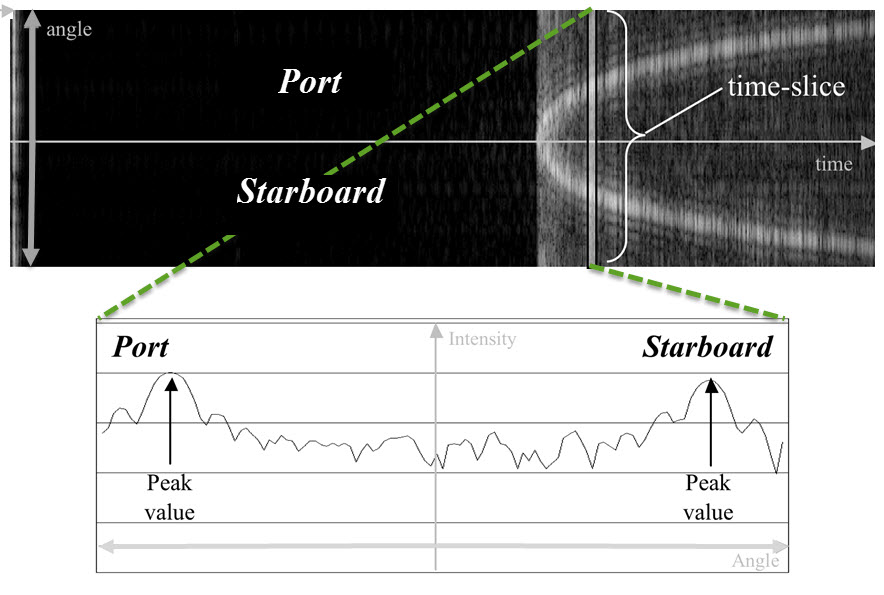
Here the individual full beam echograms, normally shown in a 'pie' display (polar coordinates)......
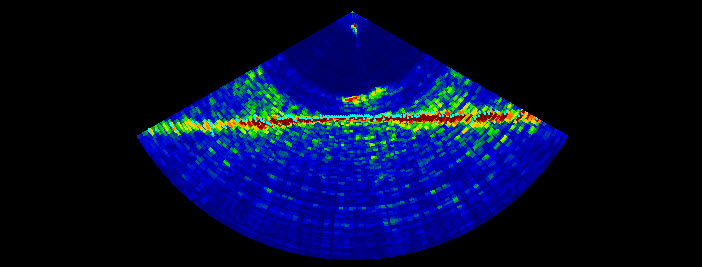
.......are stacked one on top of another (xy coordinates) as the beam angle increases to starboard and to port. If the beam echograms shown here were fanned out at the angle that the beam is steered at, the 'stacked' image would turn into a "pie" display.
The white pixels starting just right of center represent the bottom returns, the water column is shown on the left in black, and the greys are the side-lobe returns.
Interferometric Multibeam
The term “interferometry” is generally used to describe swath-sounding sonar techniques that use the phase content of the returned sonar signal to measure the angle of a wave front returned from a sonar target.
Systems using this technique are also known as Phase Differencing Bathymetric Systems, or PDBS.
Like a beam-forming multibeam, an interferometric multibeam swath system simultaneously measures two kinds of information: the direction of the echoes from the seabed (used to measure the bathymetry), and the amplitude of the returned signal used to produce sidescan-like imagery.
Both types of multibeams measure TWTT (range) and angle to a series of points on the seabed.
With a beamforming system, discrete 'beams' are mathematically formed at specific angles and echoes are detected within the footprint of each beam to determine TWTT and hence range.
The beams have a finite width and detect anything within the beam boundaries as signal. The width of beams determines the spatial resolution of the system. Even with narrow beams the further away from nadir the larger the beam's ensonified footprint becomes.
With shallower grazing angles and larger footprints the more uncertain is the horizontal resolution.
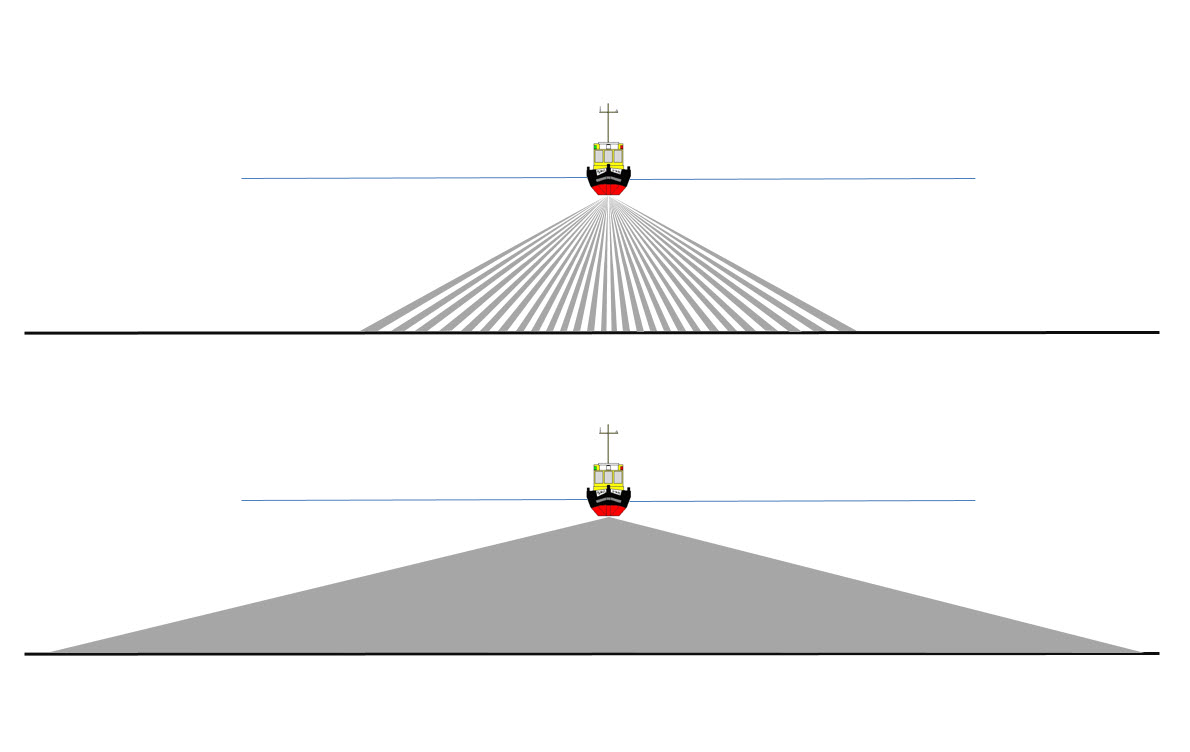
An interferometric system emits a pulse of sound which forms a narrow wavefront travelling outward from the transducer. On intersecting with the seabed the narrow wavefront creates a small ensonified patch which moves across the seabed as the sound travels outward. The patch does not increase in size with distance from nadir. Some of the scattered sound energy is received back at the interferometric transducers where the angle of the incoming sound wave fronts are measured in a time sequence of samples. For each sample the range is calculated from the TWTT. The range and angle pair per range sample enables the location of each ensonified seabed patch to be known relative to the sonar transducer.
Put succinctly, beamformers measure range for each of a set of angles, and interferometers measure angle for each of a set of ranges.
TruePix™ is a newer idea for a beamforming multibeam systems but it is ultimately outputting the same flavour of imagery/angle data as an interferometric system.
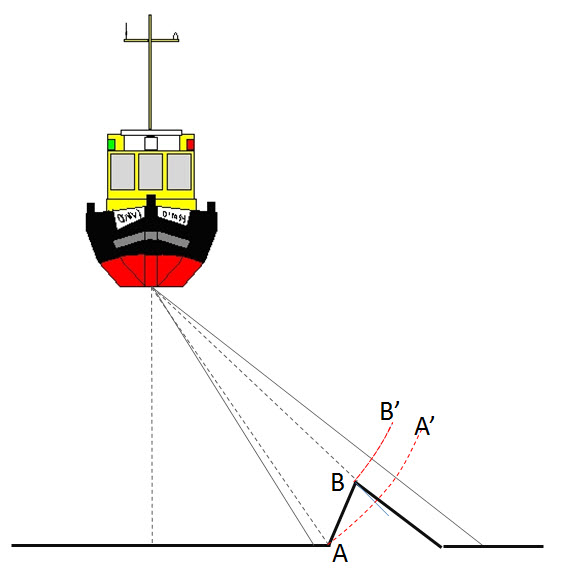
Layover
Layover occurs when a beam reaches the top of a vertical feature (B) before it reaches the base (A). The return signal from the top of the feature is received before the signal from the bottom. As a result, the top of the feature is displaced towards the transducer from its true position on the seafloor, and "lays over" the base of the feature (B' to A'). Layover is most severe for small incidence angles, at the near range of a swath, and when the seafloor is ‘mountainous’.
Useful articles/papers on MBE theory
SeaBeam Multibeam Theory Operation.pdf is recommended as background reading.
, (2002), Geometric and Radiometric Correction of Multibeam Backscatter Derived from Reson 8101 Systems, Canadian Hydrographic Conference (CHC), Toronto, Ontario, Canada, May 28 - May 31. Conference Proceeding. http://www.omg.unb.ca/omg/papers/Beaudoin_Multibeam_Backscatter_Reson_8101_Systems.pdf