
How-to Singlebeam Echosounder Raw Data
This document will guide you through the process of displaying and editing the singlebeam echosounder raw data.
On this page:
Abstract
Single Beam echo sounders have been interfaced to Qinsy from the early days on. Usually only the depth reading of the sounder is interfaced, often Qinsy sends some annotation info (Position, Fix mark number, etc.) back to the sounder as well.
But modern sounders can provide, besides the obvious digitized depth, also the full raw sounder trace, the intensity data as it was picked up from the transducer by its internal Analog to Digital Convertor.
Per measurement, often referred to as a "ping", a time series of intensity values, often expressed in Decibels is collected.
The Selected depth range of the sounder and the sample rate, that is, how many samples per second were selected, will determine the number of samples per ping.
Sometimes a start delay is used to limit the number of samples on deeper ranges. Typically between 100 and 4000 samples are acquired per ping.
These samples are used internally by the echosounder for the detection of the actual bottom. Modern sounders can transport the samples via a network interface to a third party, e.g. Qinsy.
The Qinsy driver decodes the sample data and converts it to the proprietary internal container for water column data. Once decoded within Qinsy it is stored in the database and made available for display purposes.
Which sounders can interface raw data to Qinsy?
| Brand and type | Driver Description | Link |
|---|---|---|
| Kongsberg Simrad EA400/500/600 etc. | Network - Simrad EA series | Simrad EA-series Sidescan - 27 |
| Odom EchoTrac | Network - Odom Echotrac | Network - Odom Echotrac (#MK3) - 01 |
| CEESCOPE | Network - CEESCOPE | CEESCOPE (Depth High/Low Frequency) (UTC) - 01 |
Last Update: September 2017
Other types may follow in the future.
Back-up first
Make sure to properly back-up your original databases before soundings are edited!
Inspection workflow
Proper workflow is:
- Back-up databases
- Load Database(s) in Inspector
- Inspect and edit soundings
- Save Database(s)
- Replay databases to regenerate result files (e.g. QPD's). These files will be the input of further charting, etc.
Step-by-step guide
Database Setup
By default in Qinsy the recording of the raw samples is disabled so if you are interested in using it, it should first be activated in Database Setup.
Start Database Setup with your Template Database, select the single beam echosounder setup.
On the second page of the wizard the option "Use Raw Samples" should be checked.
Note that this is to be done per channel that you wish to use so make sure to select the channel first and then activate the option.
If you then finish the wizard and save the database then the decoding of samples is activated.
Note that only for a subset of the echosounder drivers the raw sample recording can be activated.
If the "Use Raw Samples" option remains disabled even though the channel was selected then it means that for this driver the raw decoding is not (yet) possible.
Refer to the list of supported drivers above for more information.
The Calibration Factor is only used for TNO Bottom Classification algorithm and not applicable to displaying and recording of the data.
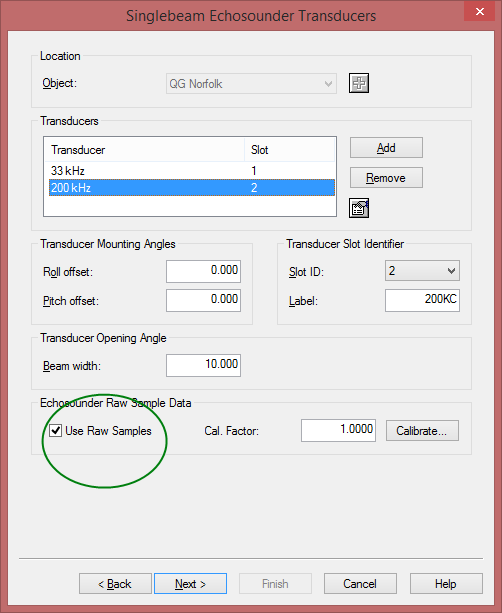
Activation of Raw Sample Data in DbSetup
Online/Replay
Start the Controller with the template or Raw Database.
The easiest way to check if the raw data of the sounder is being decoded is to start an Observation Physics Display.
Check that data is arriving in Observation Physics Display
Start a new Display and select the echosounder system.
Two observations should be shown per channel: the regular Depth and the Raw Data.
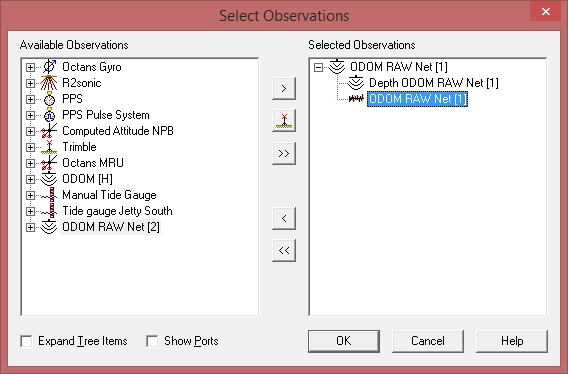
Select the Observations for the Observation Physics Display
This selection will result in the following display:
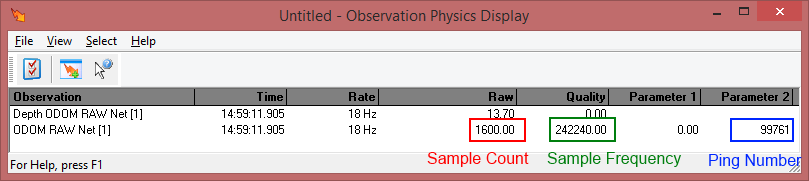
Observation Physics Display - main view
Both observations should continuously be updated at about the same update rate. If the extra columns are activated in the View Properties some extra info is shown for the Raw Sample Data.
Column "Raw" shows the number of samples per ping. "Quality" shows the sample Frequency in Hertz and "Parameter 2" shows the current ping number.
Echosounder Display
Start a new Echosounder Display. By default the water column data is disabled. Activate the Select Echosounders menu option.
Now a dialog is shown with a list of the available echosounders:
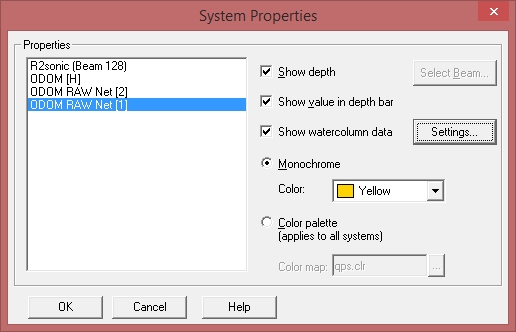
Echosounder Display - System Properties dialog
There is an option "Show watercolumn data". This can only be selected for the systems that have Raw Sample Usage enabled in Database Setup.
- There can only ever be one system that has the option "Show value in depth bar" enabled. This system also determines the update pace of the display. When this system is not updating the entire display stalls.
- There can only be one system that delivers the water column data, but if desired you can always show the water column data of another channel in a new echosounder display and show that in parallel.
- Currently only water column data for single beam systems is supported. For multibeam echosounder systems this is not yet the case. (April 2014)
If the 'Show water column data' option is enabled then the water column view Settings button is enabled.
By clicking on this button the Water Column Data Settings dialog is shown:
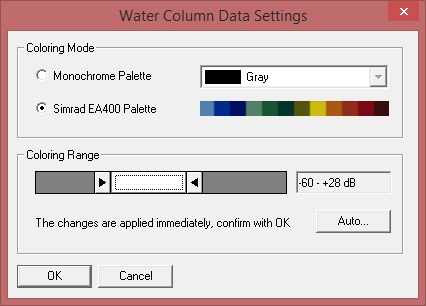
Echosounder Display - System Properties dialog - Water Column Data Settings
The Coloring Mode determines how the intensity information in Databases is translated to the RGB color value. Choose either the monochrome palette or the Simrad EA400 Palette.
The latter consists of multiple colors, the first of a single color. The maximum possible range of the intensity is -128 to + 127 dB.
Usually the range slider is adjusted to get a good fit on the current intensity values.
The Coloring Mode and Coloring Range slider settings will determine the exact Intensity to color translation.
As an example the color translation will be explained of the settings as set in the dialog above:
The lower range is -60 dB so all intensities below this limit will get the background color, by default this is black. On the other end, all intensities above 28 dB will be colored white.
The intensities between -60 and +28 will be colored according to the palette color.
The EA400 palette consists of 12 colors, so the range of 88 (60 + 28) dB is equally divided over the colors, with about 7 dB per Color.
So the lightest blue will be used for all intensities between -60 and -53, next color for intensities between -53 and -46, etc.
For the monochrome palette it works a bit differently: two color scales are used internally, from the background color to the selected color and from selected color to white.
The Auto button will determine automatically a valid coloring range for the incoming data. Note that any changes in this dialog are applied immediately to the main view for testing.
You can always press the Cancel button to revert to the previous settings.
If all settings are properly set the display will look as follows:
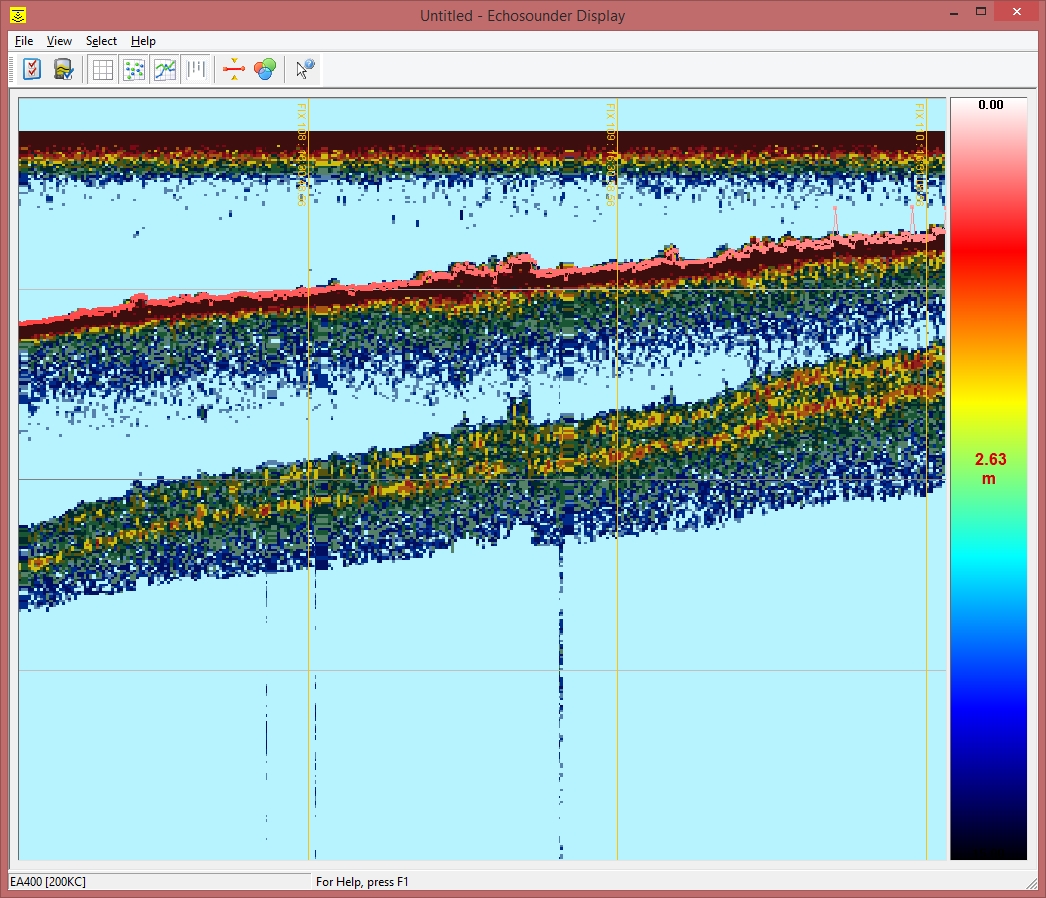
Echosounder Display with Raw data from a Kongsberg Simrad EA400
Water Column Inspector
Once the data is recorded in the database it can also be reviewed and even edited in post processing with the so-called Water Column Inspector program.
Launching
In order to start the Inspector utility select one or more raw Qinsy databases in the Raw Data Manager utility and press the icon with the fish or start from menu Action-Water Column Inspection.
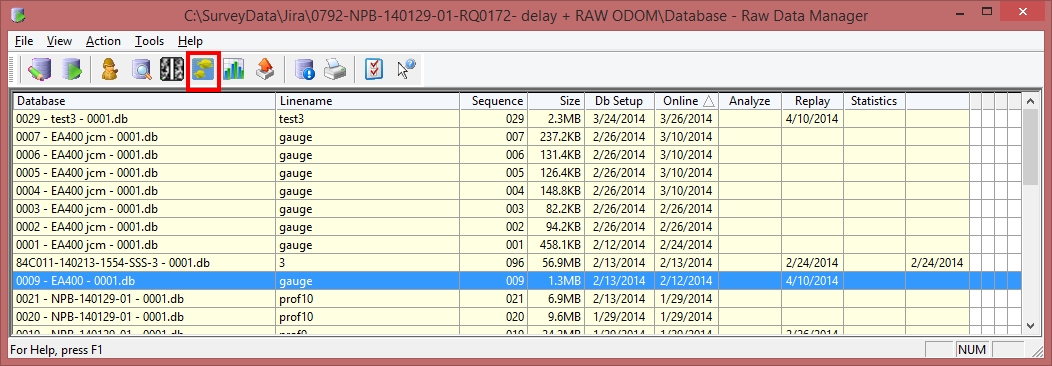
Raw Database Manager: highlight is on the toolbar button for Water Column Inspection
This launches the tool.
Viewing
During the start you will always be prompted to generate longitudinal profiles, please do this.
Also enter the maximum anticipated depth in the dialog box. You can always re-generate the profiles later on.
- Currently only a single channel can be selected for single beam.
- The sounding can be edited.
- The coloring is set up exactly the same as described above.
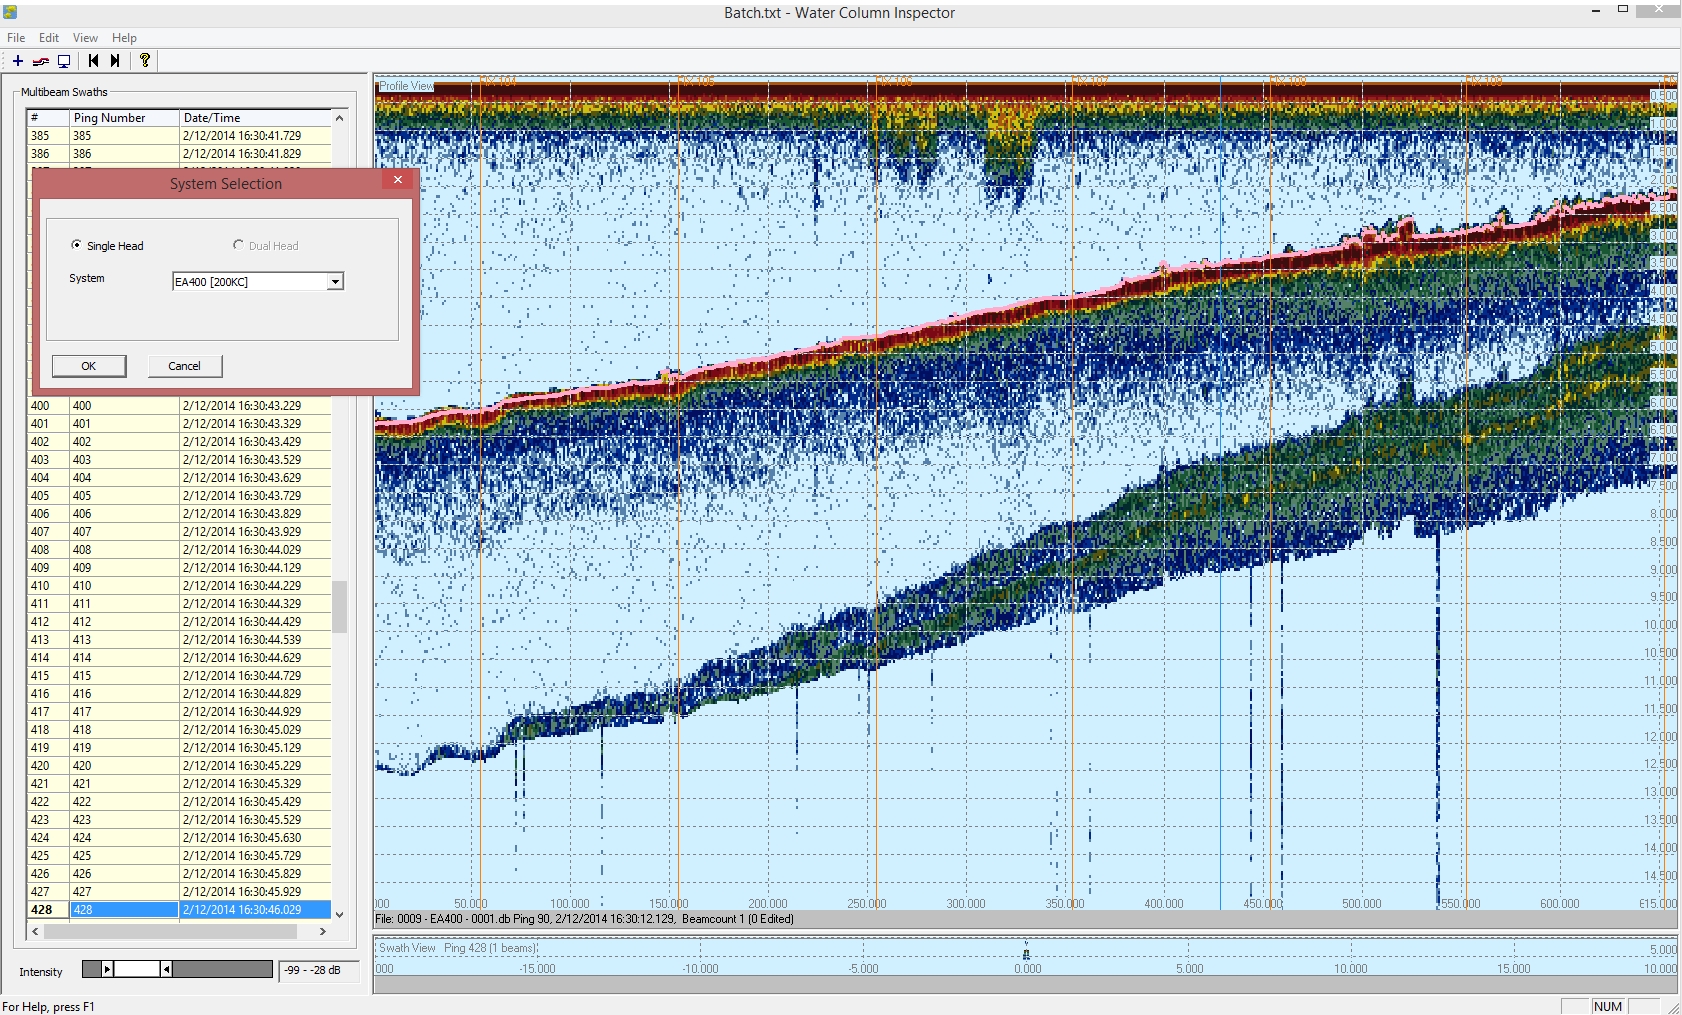
Watercolumn Inspector showing the same EA400 data
Editing soundings
Soundings can be edited but they will be overwritten in the original database.
So make sure to properly back-up your original databases before this is attempted.
The proper approach is then to replay the edited soundings to do further processing on them.
Right click on the profile view, this pops up the context menu. Select mouse mode "Edit Mouse Mode".
Next you can digitize the new depths by clicking on them.
Note that you can always undo the edits via the edit menu.
The new depths are now drawn in a different color on top of the original ones, by default in red.
See screen capture below:
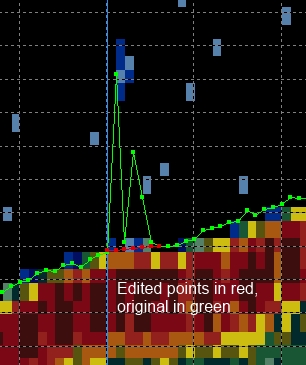
Edited sounding: green original, red edited