
4. Qinsy Replay
Qinsy Survey was developed in such a way that all the settings are stored together with the data, giving the user full control over the various settings.
After the survey has been completed and the data is being processed, all the settings can be changed. So the primary concern of the Online surveyor is to collect good raw data.
Both the system setup in the Database as well as the computational setup from the Controller can be changed in the processing session.
If all the settings are correct, replay of the data can be started. It is possible to either replay a single survey line (database) or a batch of lines.
The last option is the most common, and is used to reprocess a survey after the system setup was changed, the data was analyzed or online no sounding grid or qpd files were created.
During replay the entire line is sailed again, only this time not in real-time. While replaying the user has full control over the display settings and can show any display on screen to investigate the data.
On this page:
Replay several databases at a time
Most surveys will consist of more than one survey line. In this case doing a replay with a number of survey lines at a time speeds up the processing process.
This type of replay is called a batch replay. When using a batch it is possible to replay one database after another. All the databases need to have identical settings though.
If this is not the case, clone the settings from one database to the others, or replay the data in different batches.
- Click on Replay in the Qinsy Console
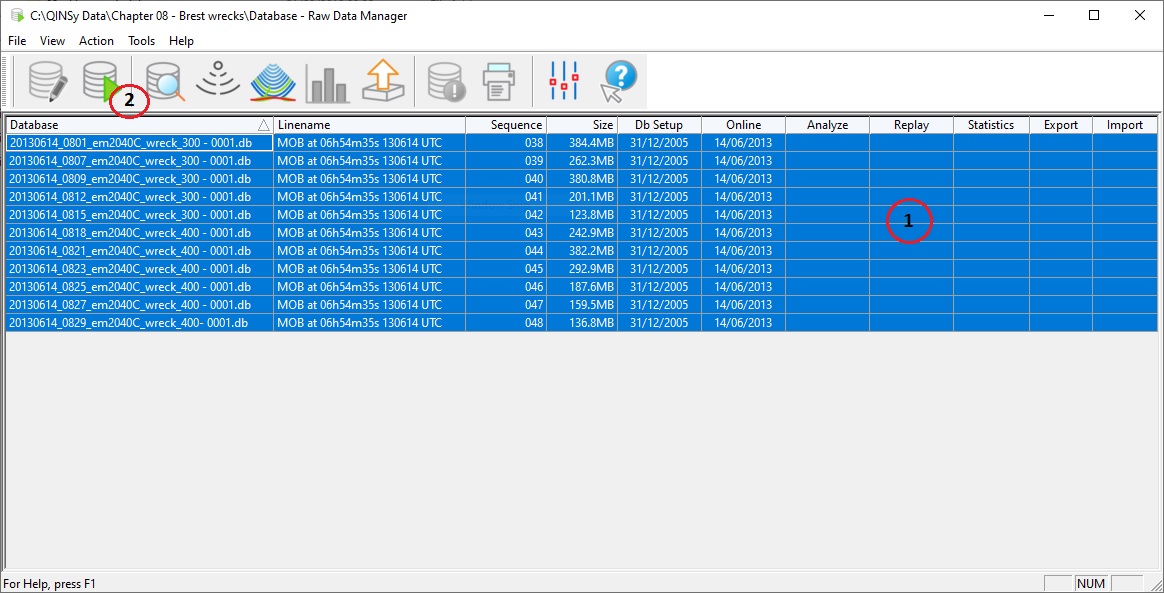
- Select the databases that need replaying
- Click on the Replay button
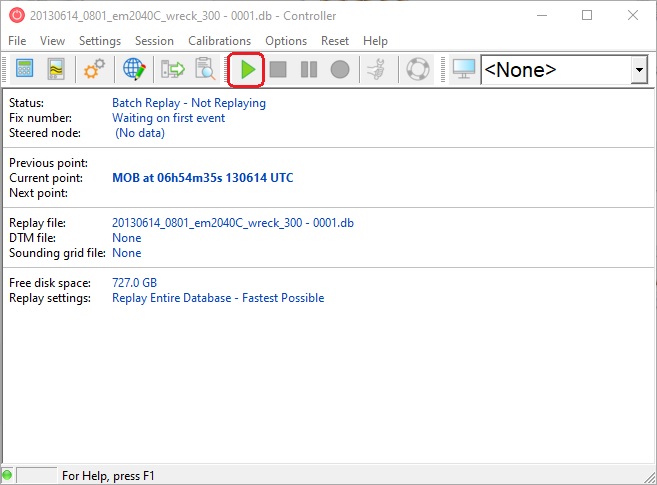
- The Controller will appear as usual, except the Replay button is active instead of the Record button.
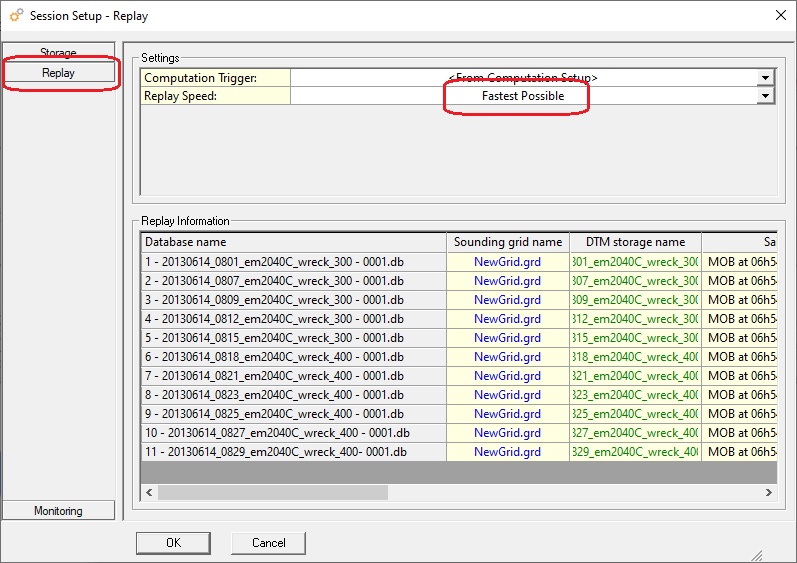
- Open the Session Setup and select the appropriate output formats.
- Open the group Replay and set the Replay Speed to full speed if a lot of data needs to be replayed.
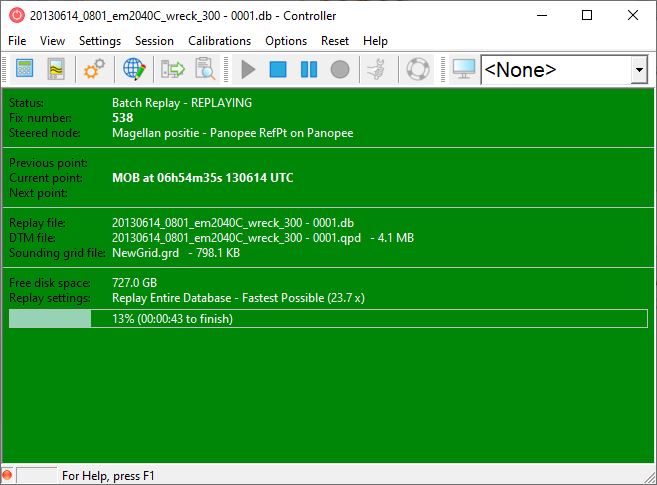
- In the ‘Controller’ press the [F3] function key or use the 'Replay' icon. All databases will be replayed.
Info
To speed up the process, do not use any online displays.
Analyze
The Analyze module is for analyzing raw data, which means that not the processed input from the sensors is shown, but the data as it was recorded.
Echosounder data is shown with the depth reading that was received during the survey, Multibeam data will show the slant range per beam, etc.
The Analyze module is not intended for validating data, but to search for erroneous sensor readings or to check sign conventions (e.g. RTK Height vs. Heave), etc.
To start the analyze module
- Highlight the database to be analyzed
- Click on the Analyze button.
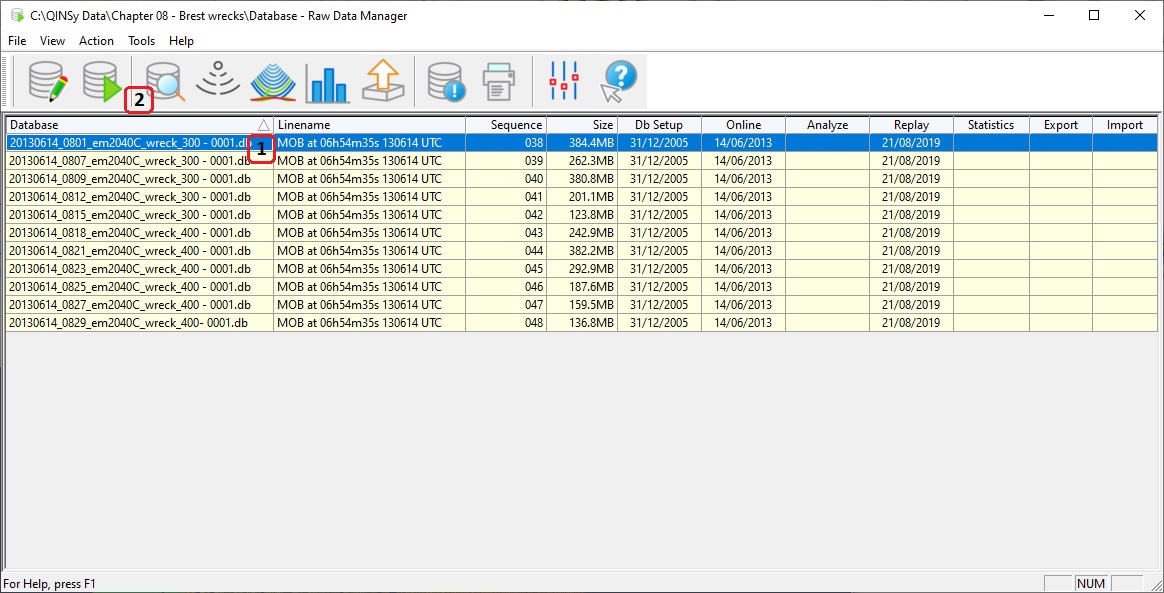
The module is started and a new window is opened:
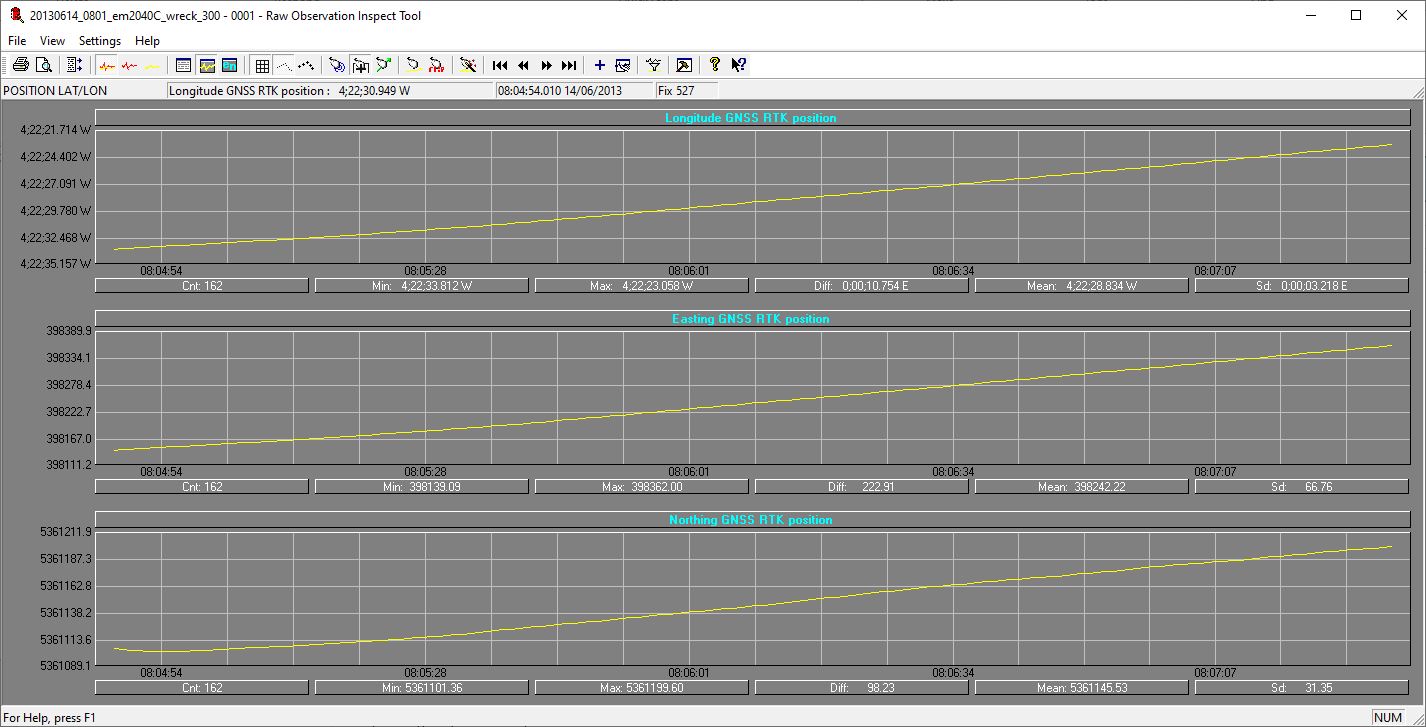
All raw data is displayed as a time series:

With the exception of the position information (Latitude, Longitude) that can also be displayed as a:

Position plot.
An alphanumeric option is also available:

The alphanumeric option can be useful to check the update rate of a system.
Tip
The alphanumeric option will only show the first x entries in the database.
To change the number of entries visible, select “Settings”, “General” from the menu and click on the “Numerical View Tab”.
Selecting observations
The first time Analyze is started, it will display all the available sensors. To (de)select sensors take the following steps:
- Click on the plus button in the toolbar.
- A new dialog window will show with all available groups / observations.
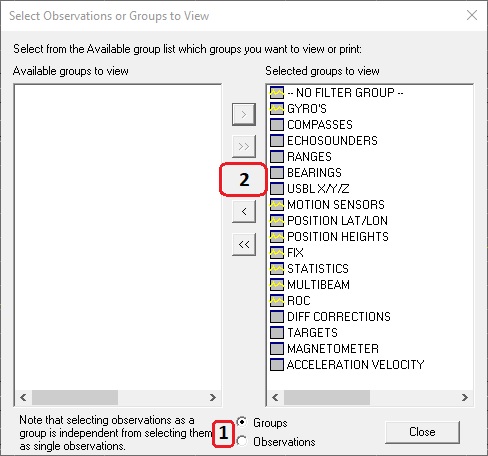
- Select the observation groups, or select single observations by changing the radio button from “Groups” to “Observations”. Observation groups contain all the observations from a certain type of sensor, e.g. all motion sensor data in the database.
It is possible to define new groups or use the default groups. - Use the > and < button to send observations from one panel to the other. Use the >> and << buttons to send all observations.
Use the scroll buttons:

In the tool bar to toggle between the selected observations. The number of observations per view can be changed using the “Settings”, “General” option from the menu bar.
Use the “Observation Graphs” tab and set the number of observations to be displayed in the view.
With the buttons:

In the tool bar, the mouse mode can be selected. The last button is a function whereby a line can be drawn between observations, noting the time difference and the value difference between the two sensors.
This is a useful tool when investigating delays between sensor readings.
Filtering data
It is possible to define the filter groups by clicking on the button:

From the tool bar. Filter groups are used for automatic editing of data. This can be de-spiking raw data, smoothing it or adding a latency.
The last option can be very important if a latency in e.g. the positioning system was found only after the survey was performed.
To apply this latency, a specific filter first using the:

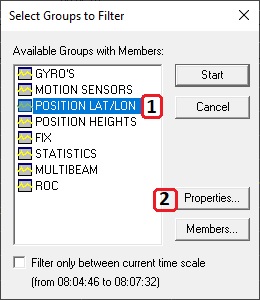
Option needs to be set up. A new dialog will show:
- Select the group to be filtered (e.g. Position Lat/Lon)
- And click on the “Properties” button. This will open the filter settings dialog:
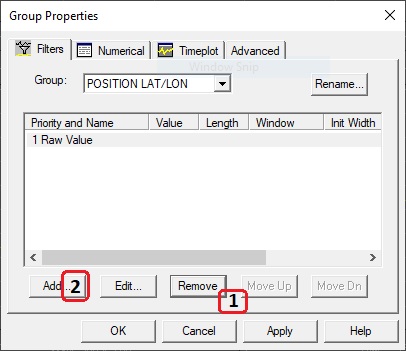
- Remove all the filters that are not needed.
Leave the Raw data filter in place, since this will ensure that all data is filtered using the raw data as a base. - Add a new filter by clicking on the “Add” button. A new dialog will appear:
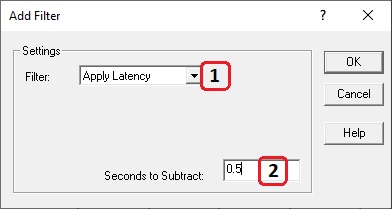
- Select the appropriate filter from the pull down menu
- And enter the settings. These settings depend on the type of filter that was selected.
Complete the filter setup and click on the Start button in the filter selection dialog.
Tip
More information on filter settings can be found in the F1 inline Help.
Note
If a position latency filter is used make sure that the same filter is also applied to the height data from the same system.
Note
It is not possible to change the latency in the database and replay the data. The latency in the database is only used during an online session.
Note
When data is edited or filtered with the Analyze tool, the edited data point is interpolated and not removed.
De-Spiking data
It is possible to de-spike raw data from within the Analyze module. Using the edit options false heave may be corrected or spikes in the gyro output.
These edit options are not meant for validating the data, use the Survey Manager/Qimera for this.
To correct false data, click on the:

button from the toolbar. Now draw a box around the correct data for a specific sensor.
Erroneous data will be labeled and depending on the view settings will show on screen in a different color.
Use the

buttons in the tool bar to switch between the different views.
To manually edit the data, click on the button:

And draw a line where the data is supposed to be.
Extract Settings
With Extract Settings it's possible to create a template database file from a recorded database file.
This can be very usefuly when you lost the template or when the template was corrupted.
- Select a recorded database in the Raw Data Manager
- Select Extract Settings from the Tools menu
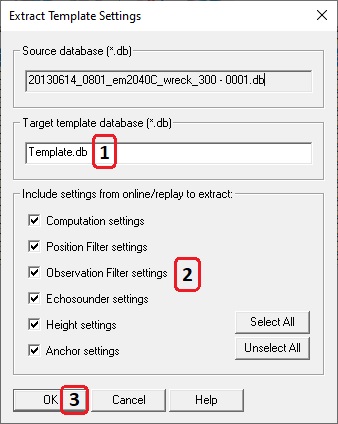
- Enter a name for the Template database
- Enable (or disable) settings from the Controller to extract to the template database
- Press OK
Clone Settings
When settings have been changed in a database, it is possible to copy these settings to other databases (recorded or template).
- Select the database from which to clone the settings.
- Open Clone Settings from the Tools menu
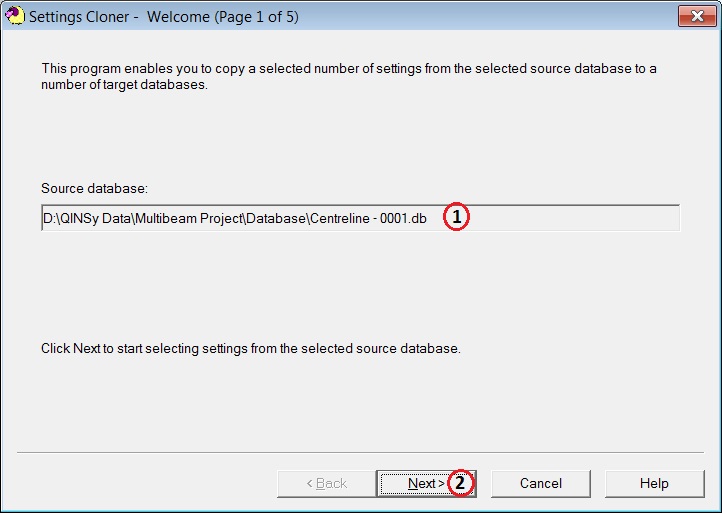
- Check the selected source database
- Click Next.
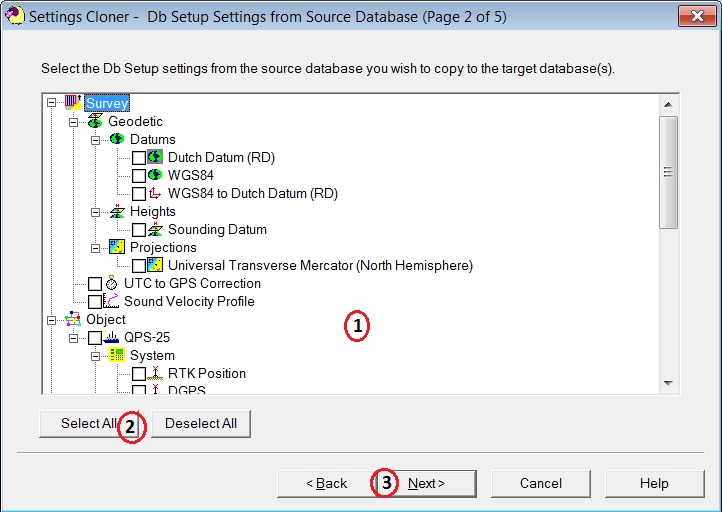
- Select the database settings to be cloned.
- Or use Select All to clone all settings
- Click on Next
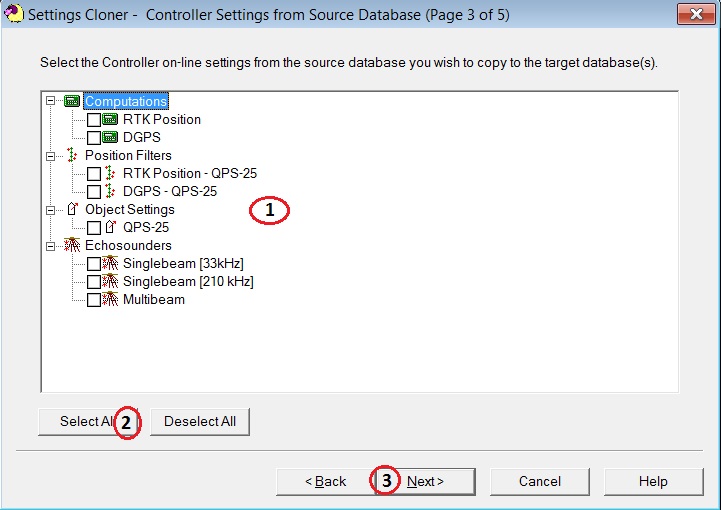
- Select the Controller settings to be cloned.
- Or use Select All to clone all settings
- Click on Next
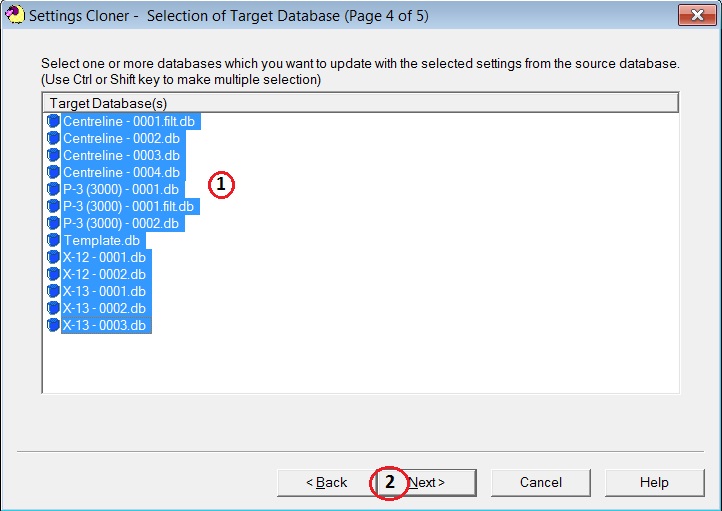
- Select the Databases to which the settings need to be cloned.
- Click on Next
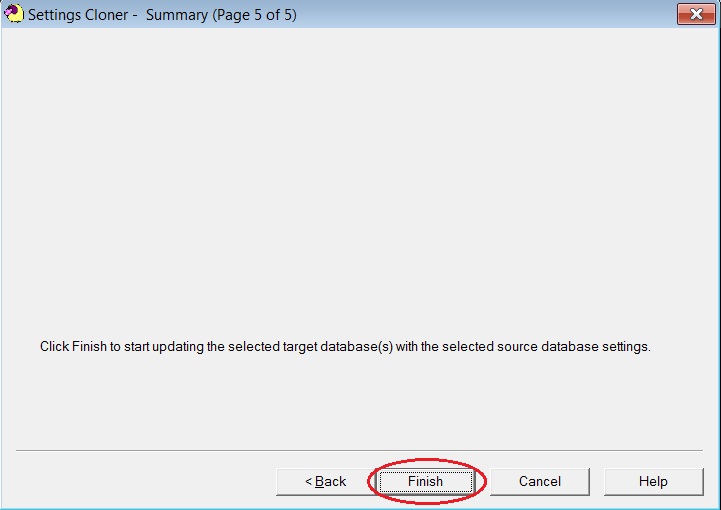
- Click on Finish.
Note
After cloning make sure to replay the databases to create new DTM files or a new Sounding Grid.