
Plotting in the Survey Manager requires a Plot Template. This template can be used in any project.
The template itself is a layout of a specific paper size and can contain any number of plan views, profile views, frames, images and text elements.
On this page:
Create a Template
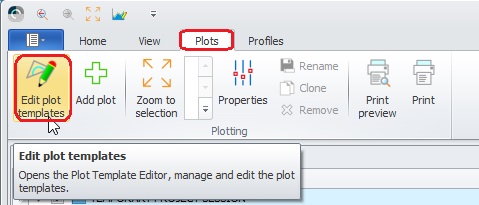
Press Edit Plot Templates
The available groups in the editing program are:
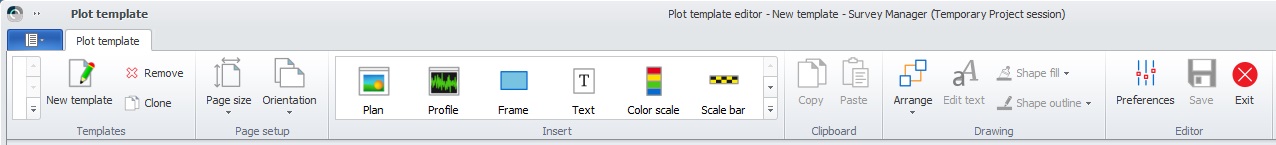
Templates - Create a new template or edit an existing one as listed on the left.
Page Setup - The Page Setup group is used to set the paper size and orientation for the Plot Template. The size and orientation can still be changed during the creation of the Plot Template.
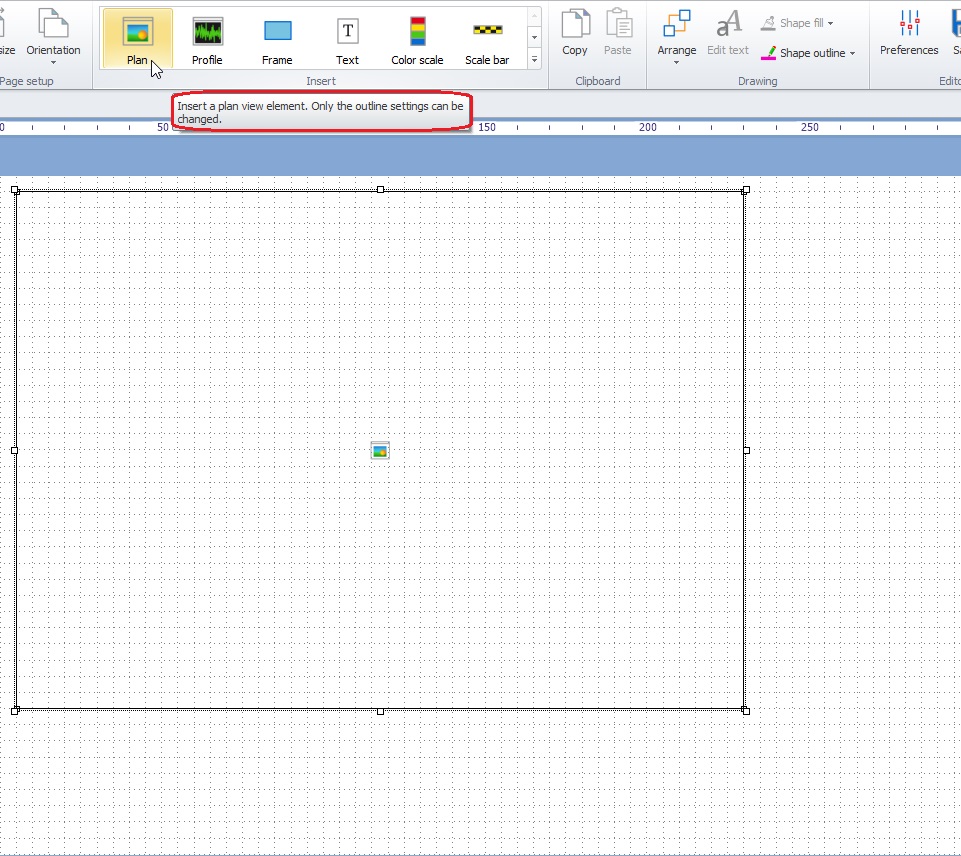
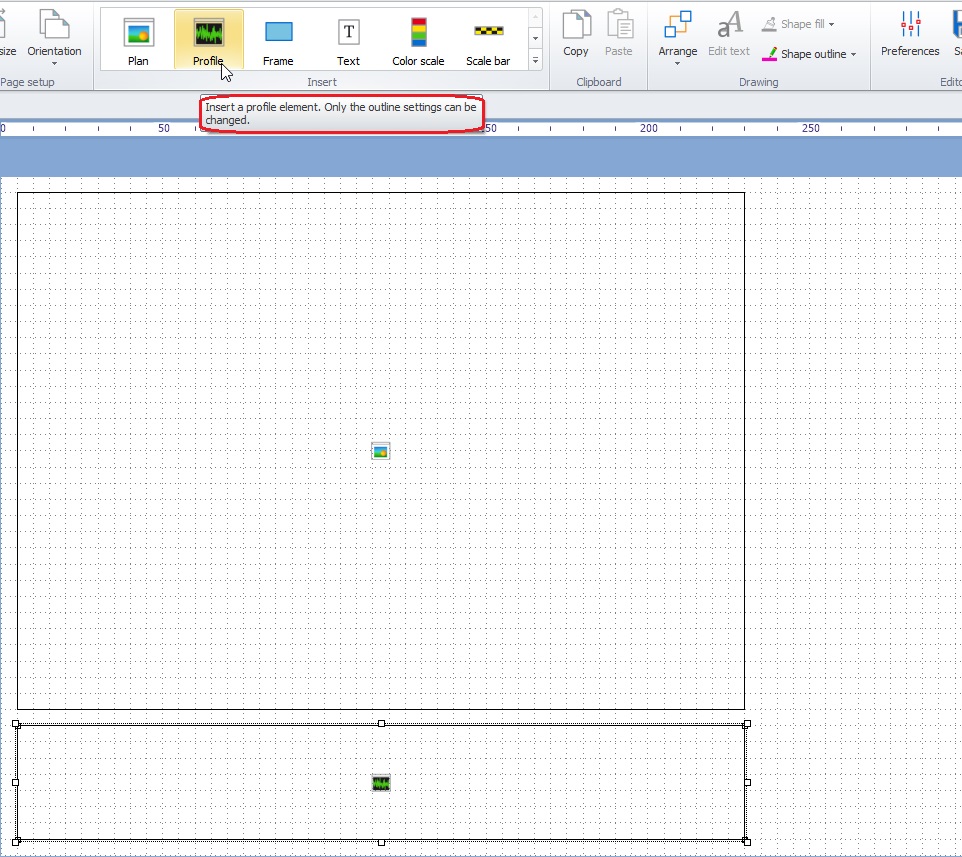
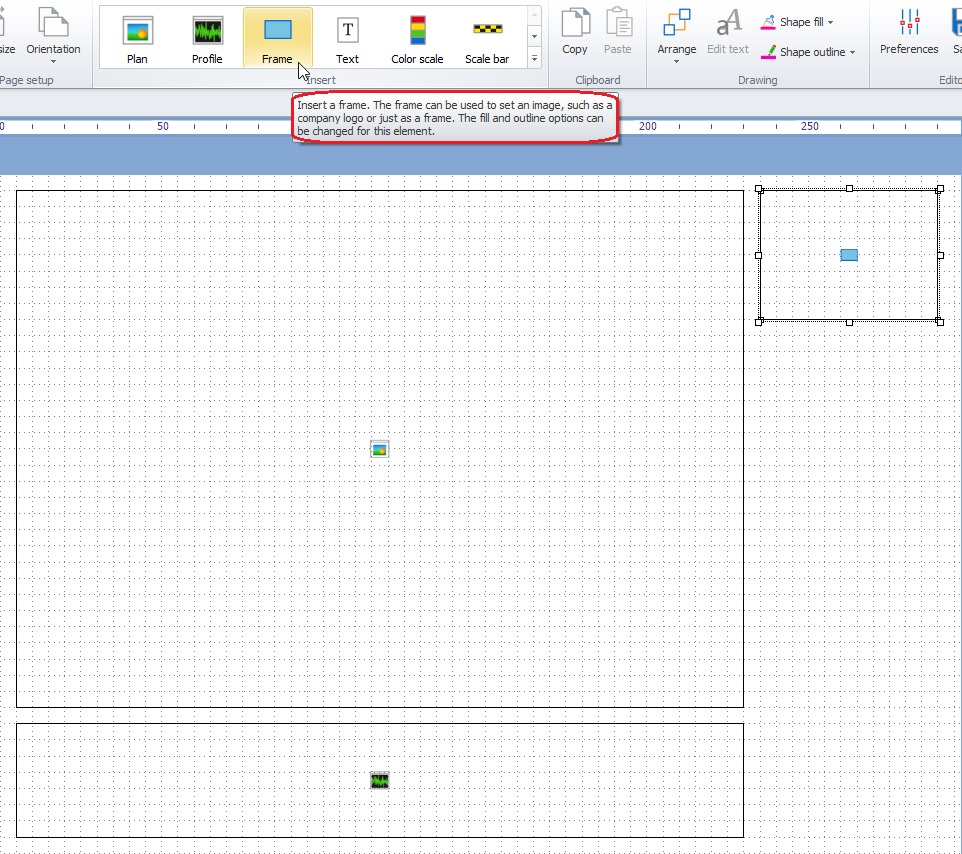
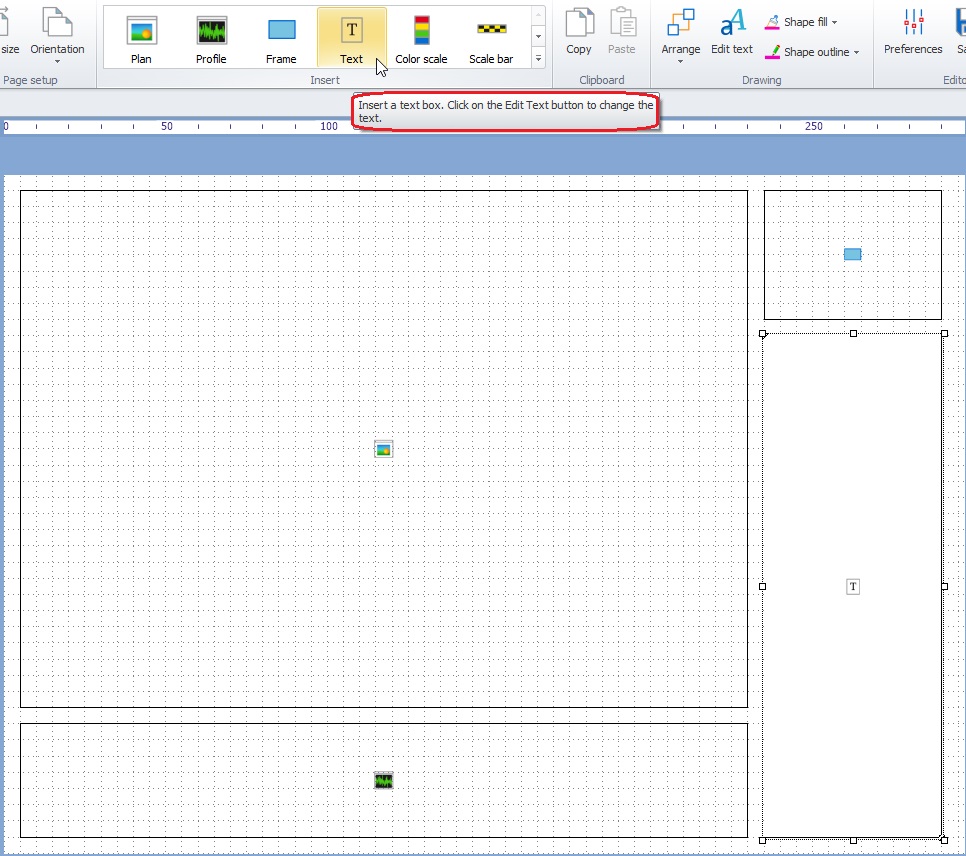
Insert - All available elements to insert in the plot are found in the Insert group. Click any of the items to start drawing. Then drag the shape to the desired location. Size and location can be changed by dragging the handles.
Clipboard - Items inside the template can be copied and pasted to make sure they get the same dimensions.
Drawing - Change the drawing order, color and style of the selected objects in the Drawing group or edit text, change the fonts or adjust the text size.
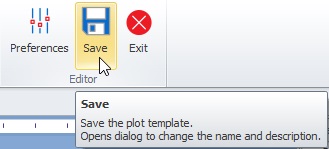
Editor - Use the Editor group to set up how the designing space should look and behave, save or exit the Plot Template Editor.
Edit the Preferences
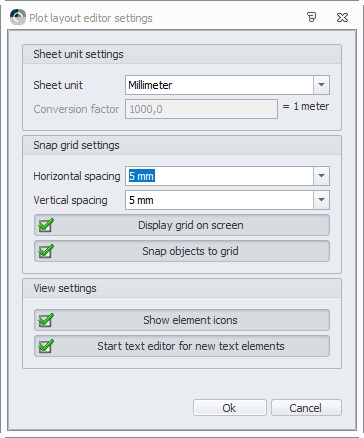
To set the Sheet unit, select one of the standard units (Millimeter or Inches) or set a custom unit. The conversion factor is always shown relative to meters.
The Snap grid settings are used for the onscreen grid. The grid can be used to align objects with the snap option, or as a visual aid. Use the grid spacing for accurate grid snapping.
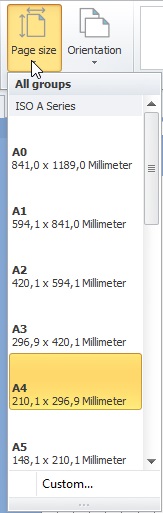
Set paper size
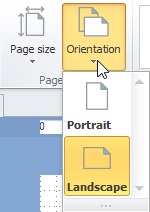
Set paper orientation
Insert elements
Each element has a tool tip : a short description of its function.
Use these tool tips to decide which elements to insert into the template.
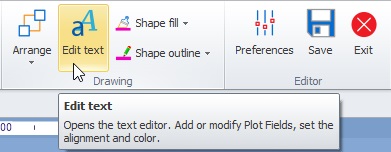
Press Edit Text
When in the Preferences the option 'Start text editor for new text elements' was not activated, use the Edit Text button to add and edit text in the text box.
Enter text for textbox
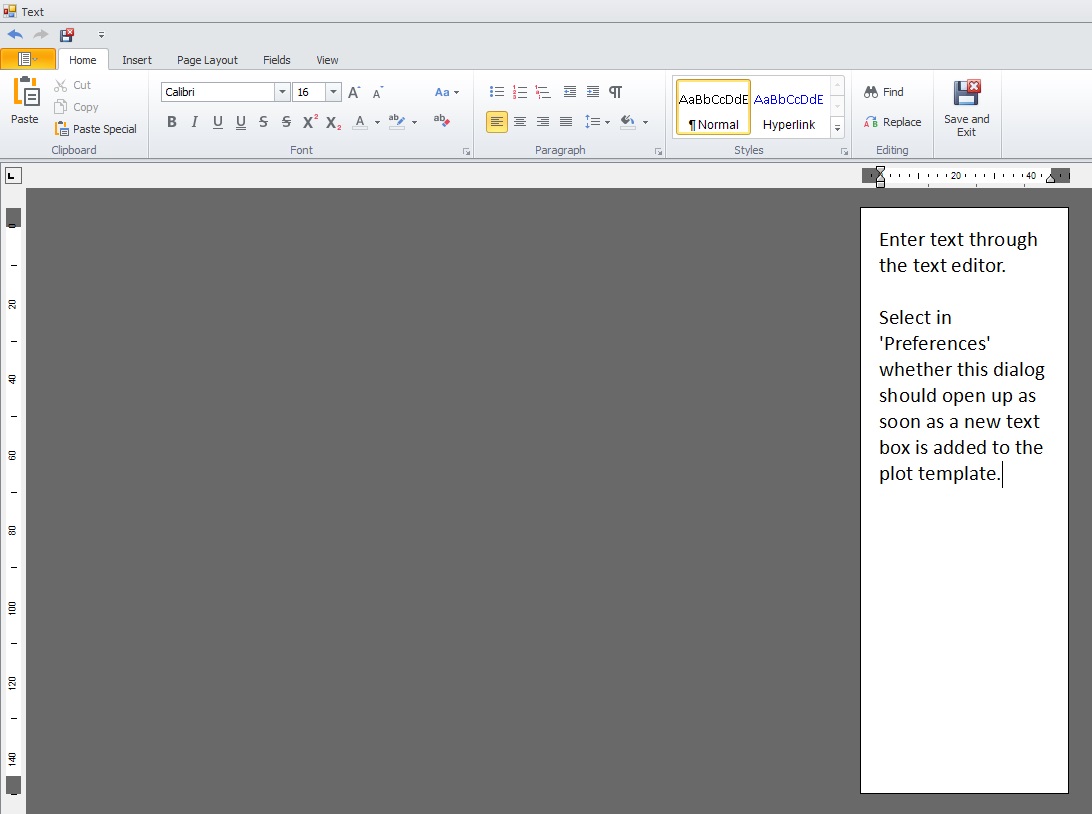
Type text in the blank area.
Select the Fields tab
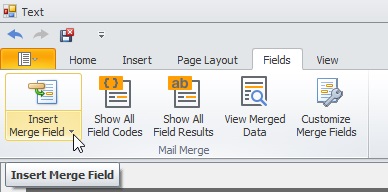
Insert a predefined field from the drop down list to add to your text box.

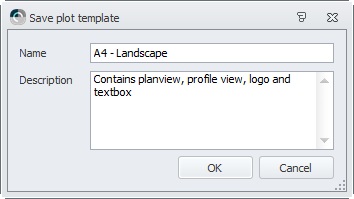
Save the new template
Enter a name and description for the template
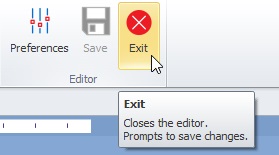
Exit Plot Template Editor
Once a Plot Template is created, a Plot can be made up.
Create a Plot
In the plot you define which data will be in the template and how it will look.
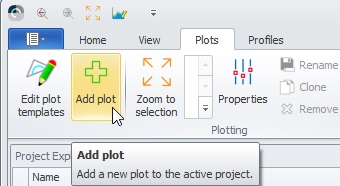
Press Add Plot to create a plot
Select a plot type
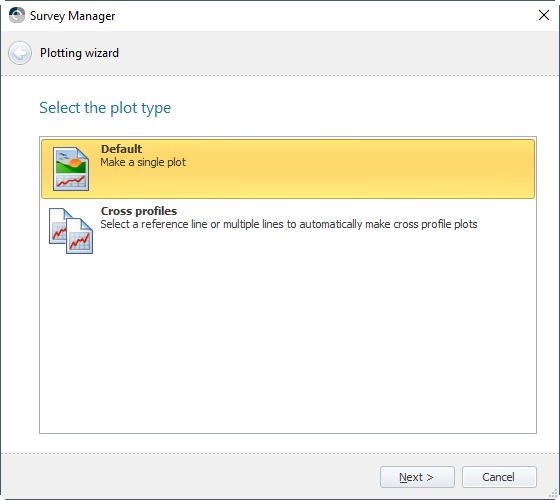
Use Cross profiles when you have a template with only profiles and no plan element.
Press Next.
Select the plot template
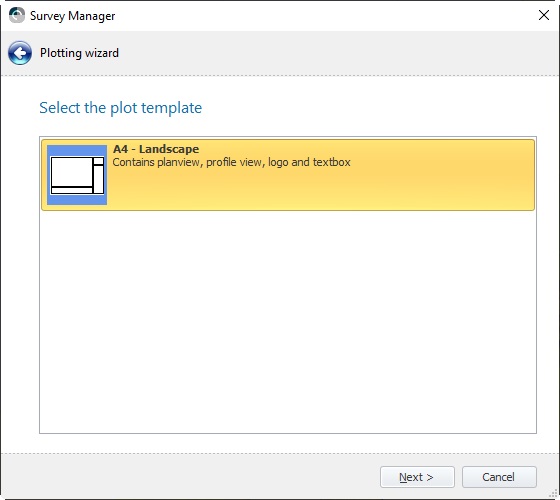
Press Next.
Enter a name for the current plot
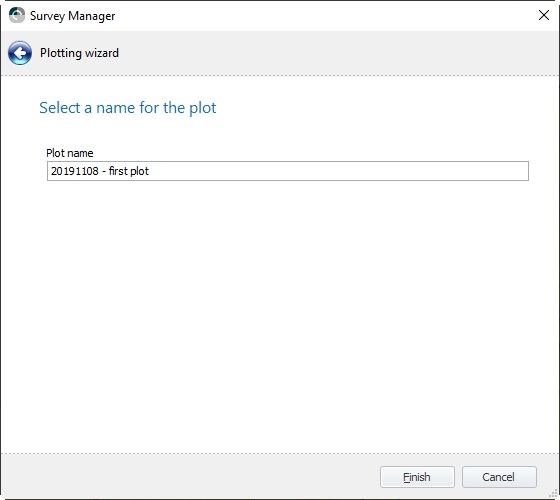
Press Finish.
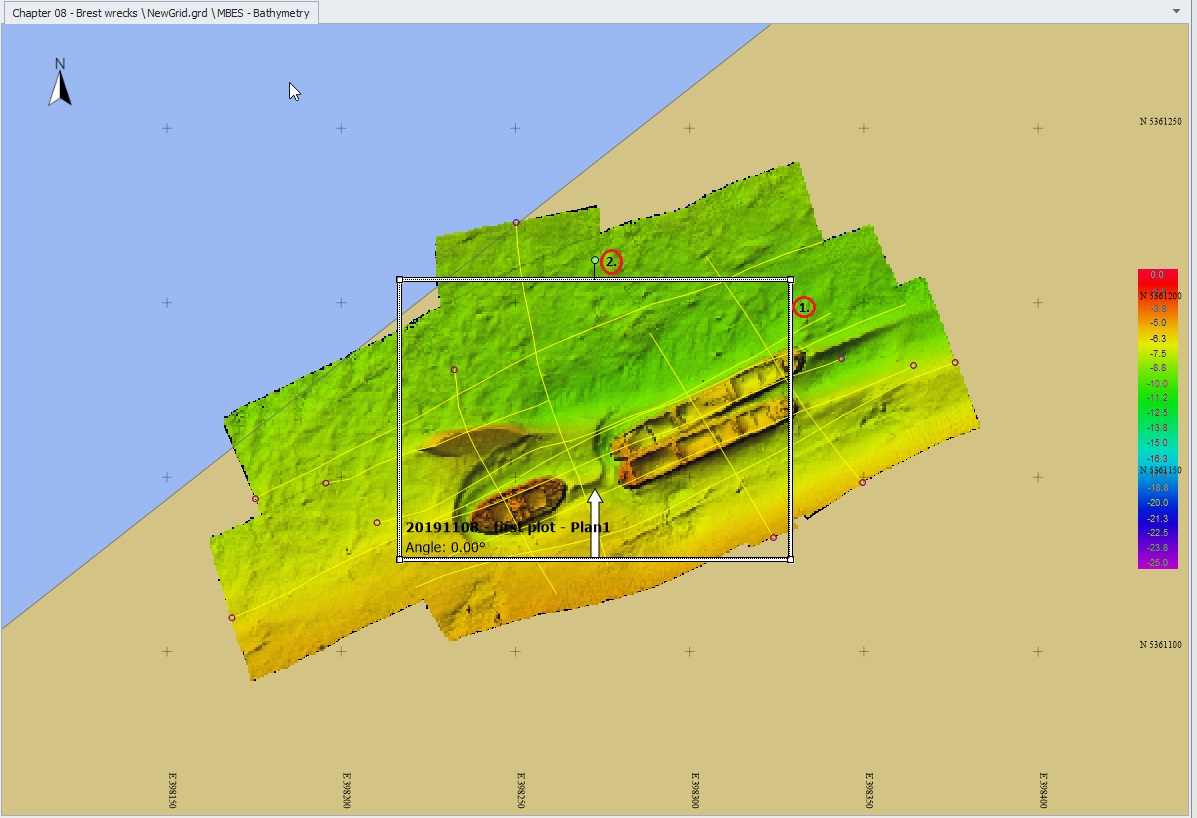
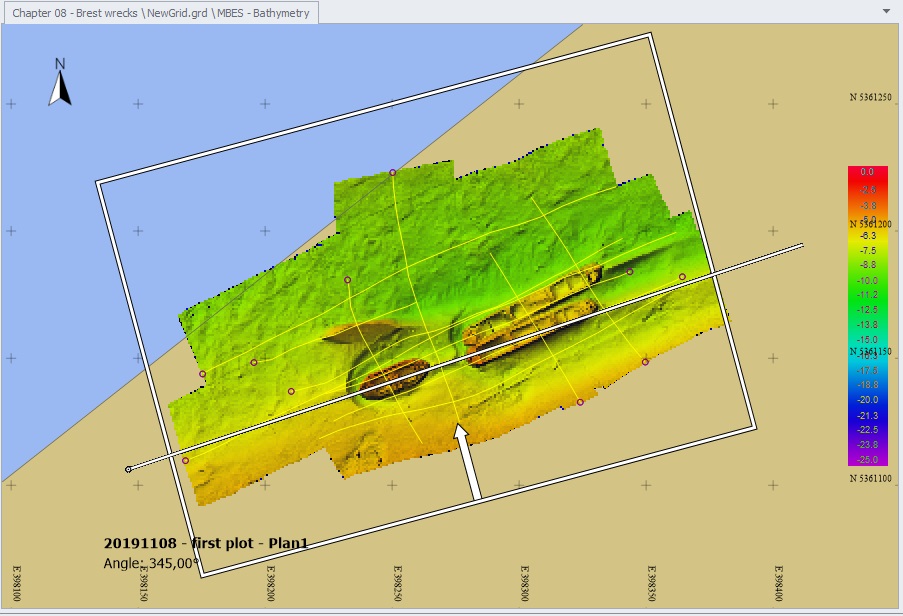
The plan element of the plot template will be shown in the Project Window.
There are two ways to place the plot in the right area:
-
Either adjust it in the Project Window:
-
Click on the edge of the plot and drag the frame to the correct place; click on the handles in the corners to change the shape.
-
The plot can be rotated by placing the mouse cursor over the green dot, holding the left mouse button and dragging the frame.
-
Or manually enter settings in the Plotting Properties Dialog:
see below
Press Properties
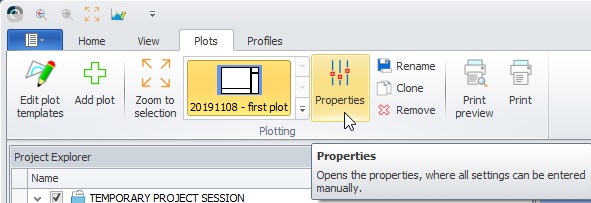
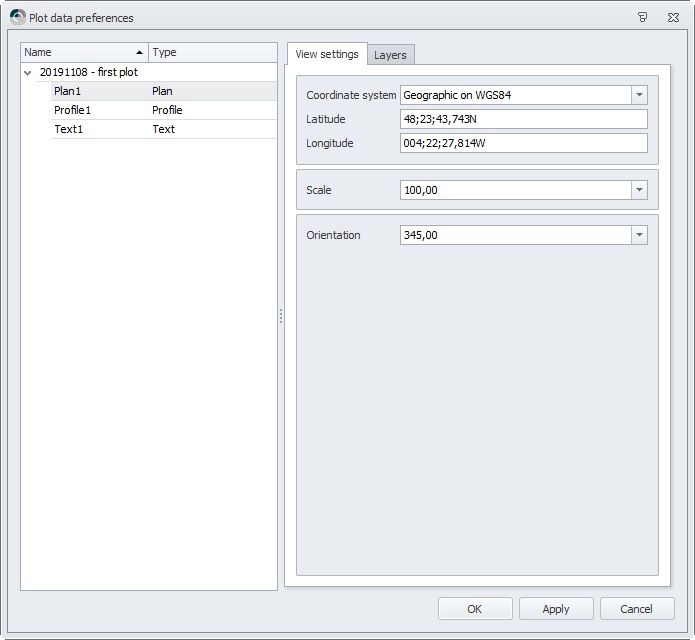
Now it is possible to enter the center coordinate for the plot and a Scale and Orientation.
Add Data to the Plot
Choose which Layers to present in the Plan box in the plot
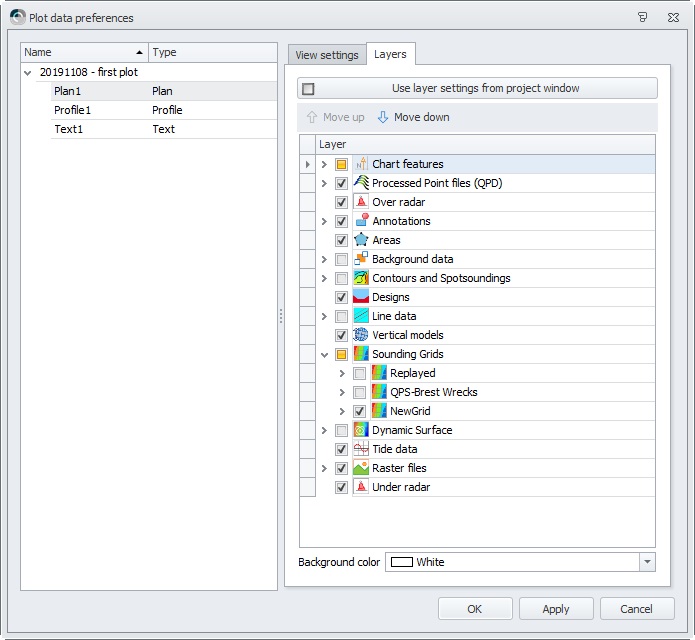
Press Apply to implement new settings without leaving the dialog box.
Choose which line to show in the Profile Plan
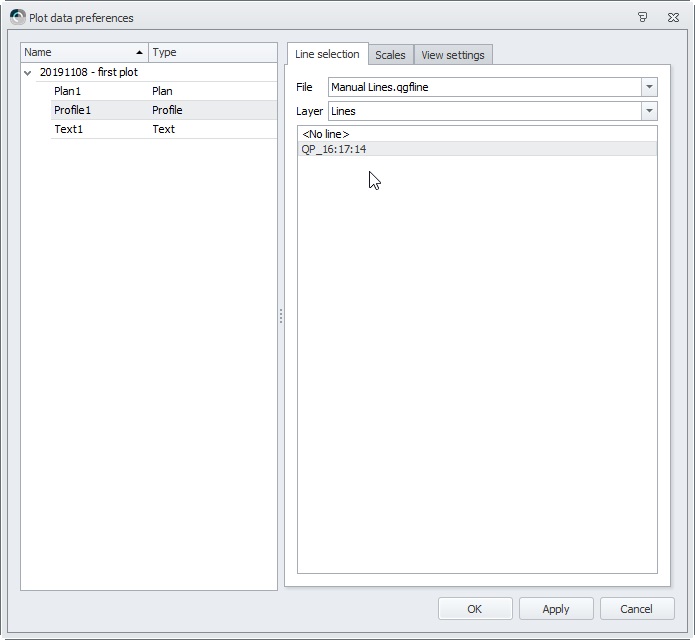
Check the scales of the profile window
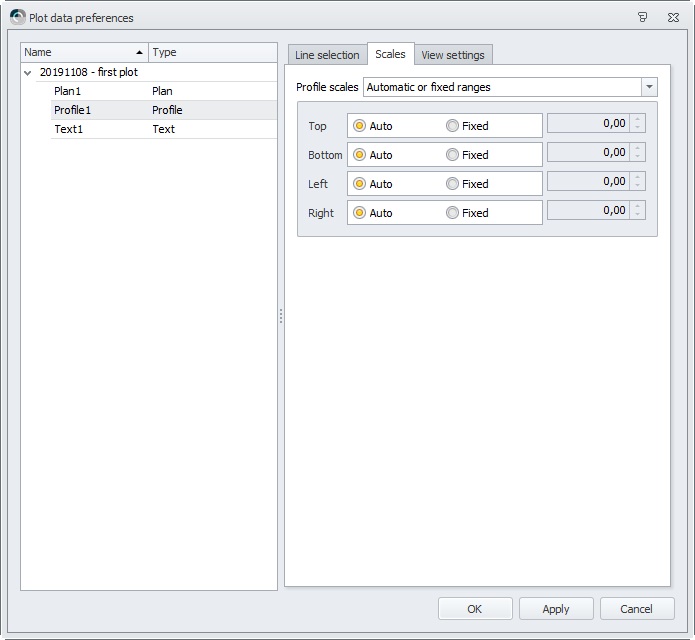
By choosing Auto, the profile will automatically be centered in the Profile frame.
Choose how to present the profile
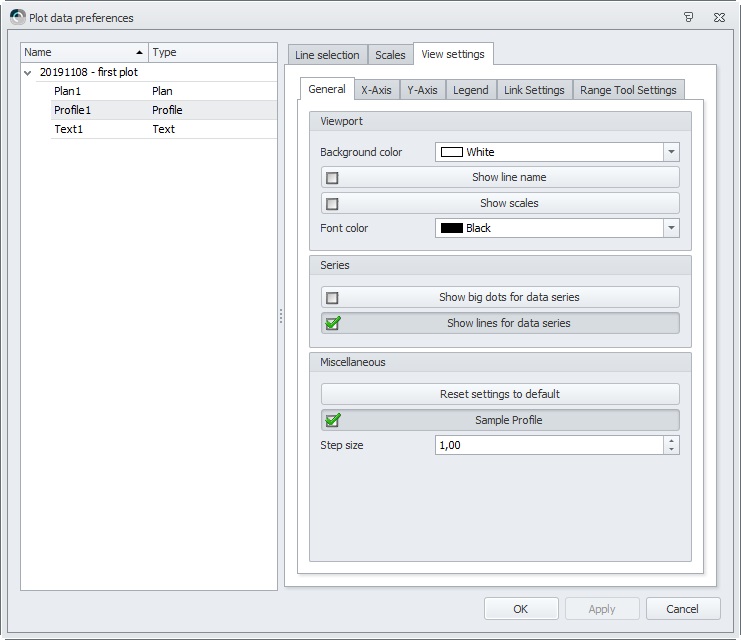
Use the different tabs for the settings for X-Axis and Y-Axis, Legend, etc.
Press OK to exit the dialog box.
Check the Plot Plan in the Project View window
Use Print Preview to check what will be plotted:
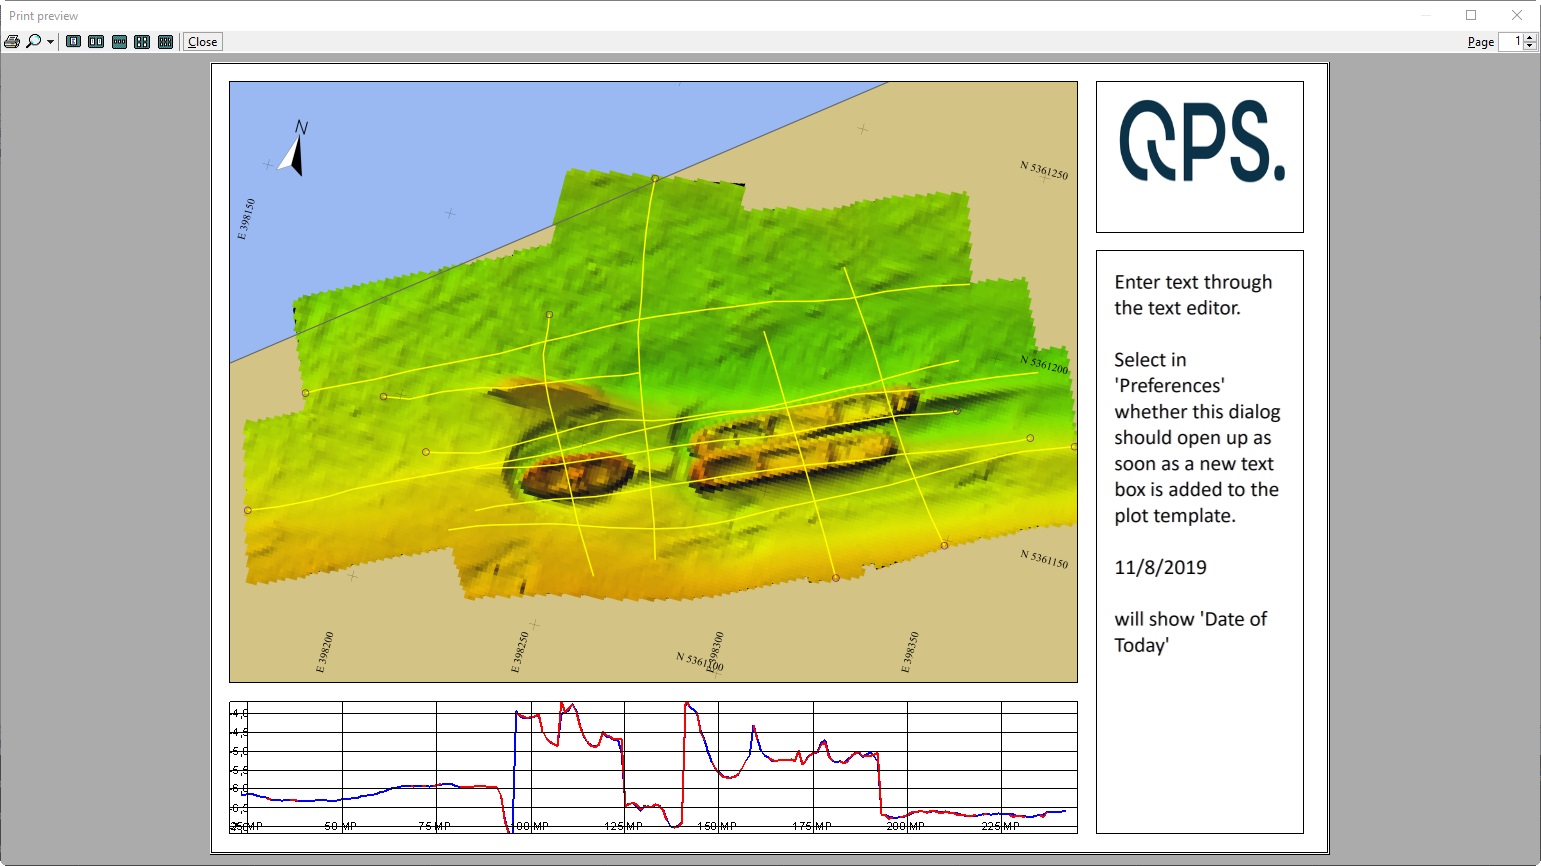
Print or Plot the file
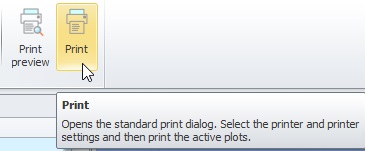
A standard MSWindows setup page for printing will appear.