Qimera 2.3.1 - New Functionality
On this page:
Introduction
In this release, we introduce a few vertical and horizontal shifting tools to add to the Height-Matching add-on that was released with Qimera 2.2. These are meant for use offshore where vertical and/or horizontal referencing can be more challenging, for both surface and subsurface vehicles. Contact sales@qps.nl if you'd like to arrange for an evaluation of the height-matching add-on.
We've also added some of the time-series editing tools from Qinsy's Validator tool to allow for more options and flexibility when reviewing and editing time-series data. For bathymetric lidar users, we've added some capabilities to do granular reclassification of points for LAS/LAZ files. Finally, we've also added kilometer post (KP) support for Qinsy users that have a route loaded in their project for which KP is reported along the route. Read on below for more detail!
New Horizontal and Vertical Shifting Tools
There are three new tools being added to the Auto-Height Matching add-on that was released with Qimera 2.2. Before diving into the details for each tool, let's first look at what they all have in common:
- All three new tools are included in the Auto-Height Matching add-on. Contact sales@qps.nl to setup an evaluation.
- They all have a common application use case: working offshore where horizontal and/or vertical referencing can be challenging, especially for sub-sea vehicles
- All shift the underlying point cloud, in case you need to deliver point clouds as a final product as well
- All can be reported with specialized exports within each tool
- Overview of resulting shifts can be reviewed and reported on from the Processing Settings
Varying Vertical Shift Tool
This tool computes a time-varying vertical offset between two surfaces using the statistical data generated by a traditional surface difference. The main advantage of this particular tool is that it examines the ping point cloud data in the Dynamic Surface that you wish to shift and uses this to determine the optimal shift along the navigation track, allowing the shift to thus vary along track. This can be used to correct for a number of dynamic errors such as tide drift, heave bandwidth, or just differences in vertical referencing in between successive surveys. The tool is designed to work optimally, for the moment, for long linear corridor surveys such as those running along a pipe or cable route where the survey must be matched against a previous survey to assess changes in seabed conditions in the vicinity of the pipe or cable. It can be used though to repair problems with height accuracy drop outs with post-processed navigation, for example, as shown in the four part sequence below where a single survey line with a poor SBET solution is repaired against a surface build from the neighboring lines.
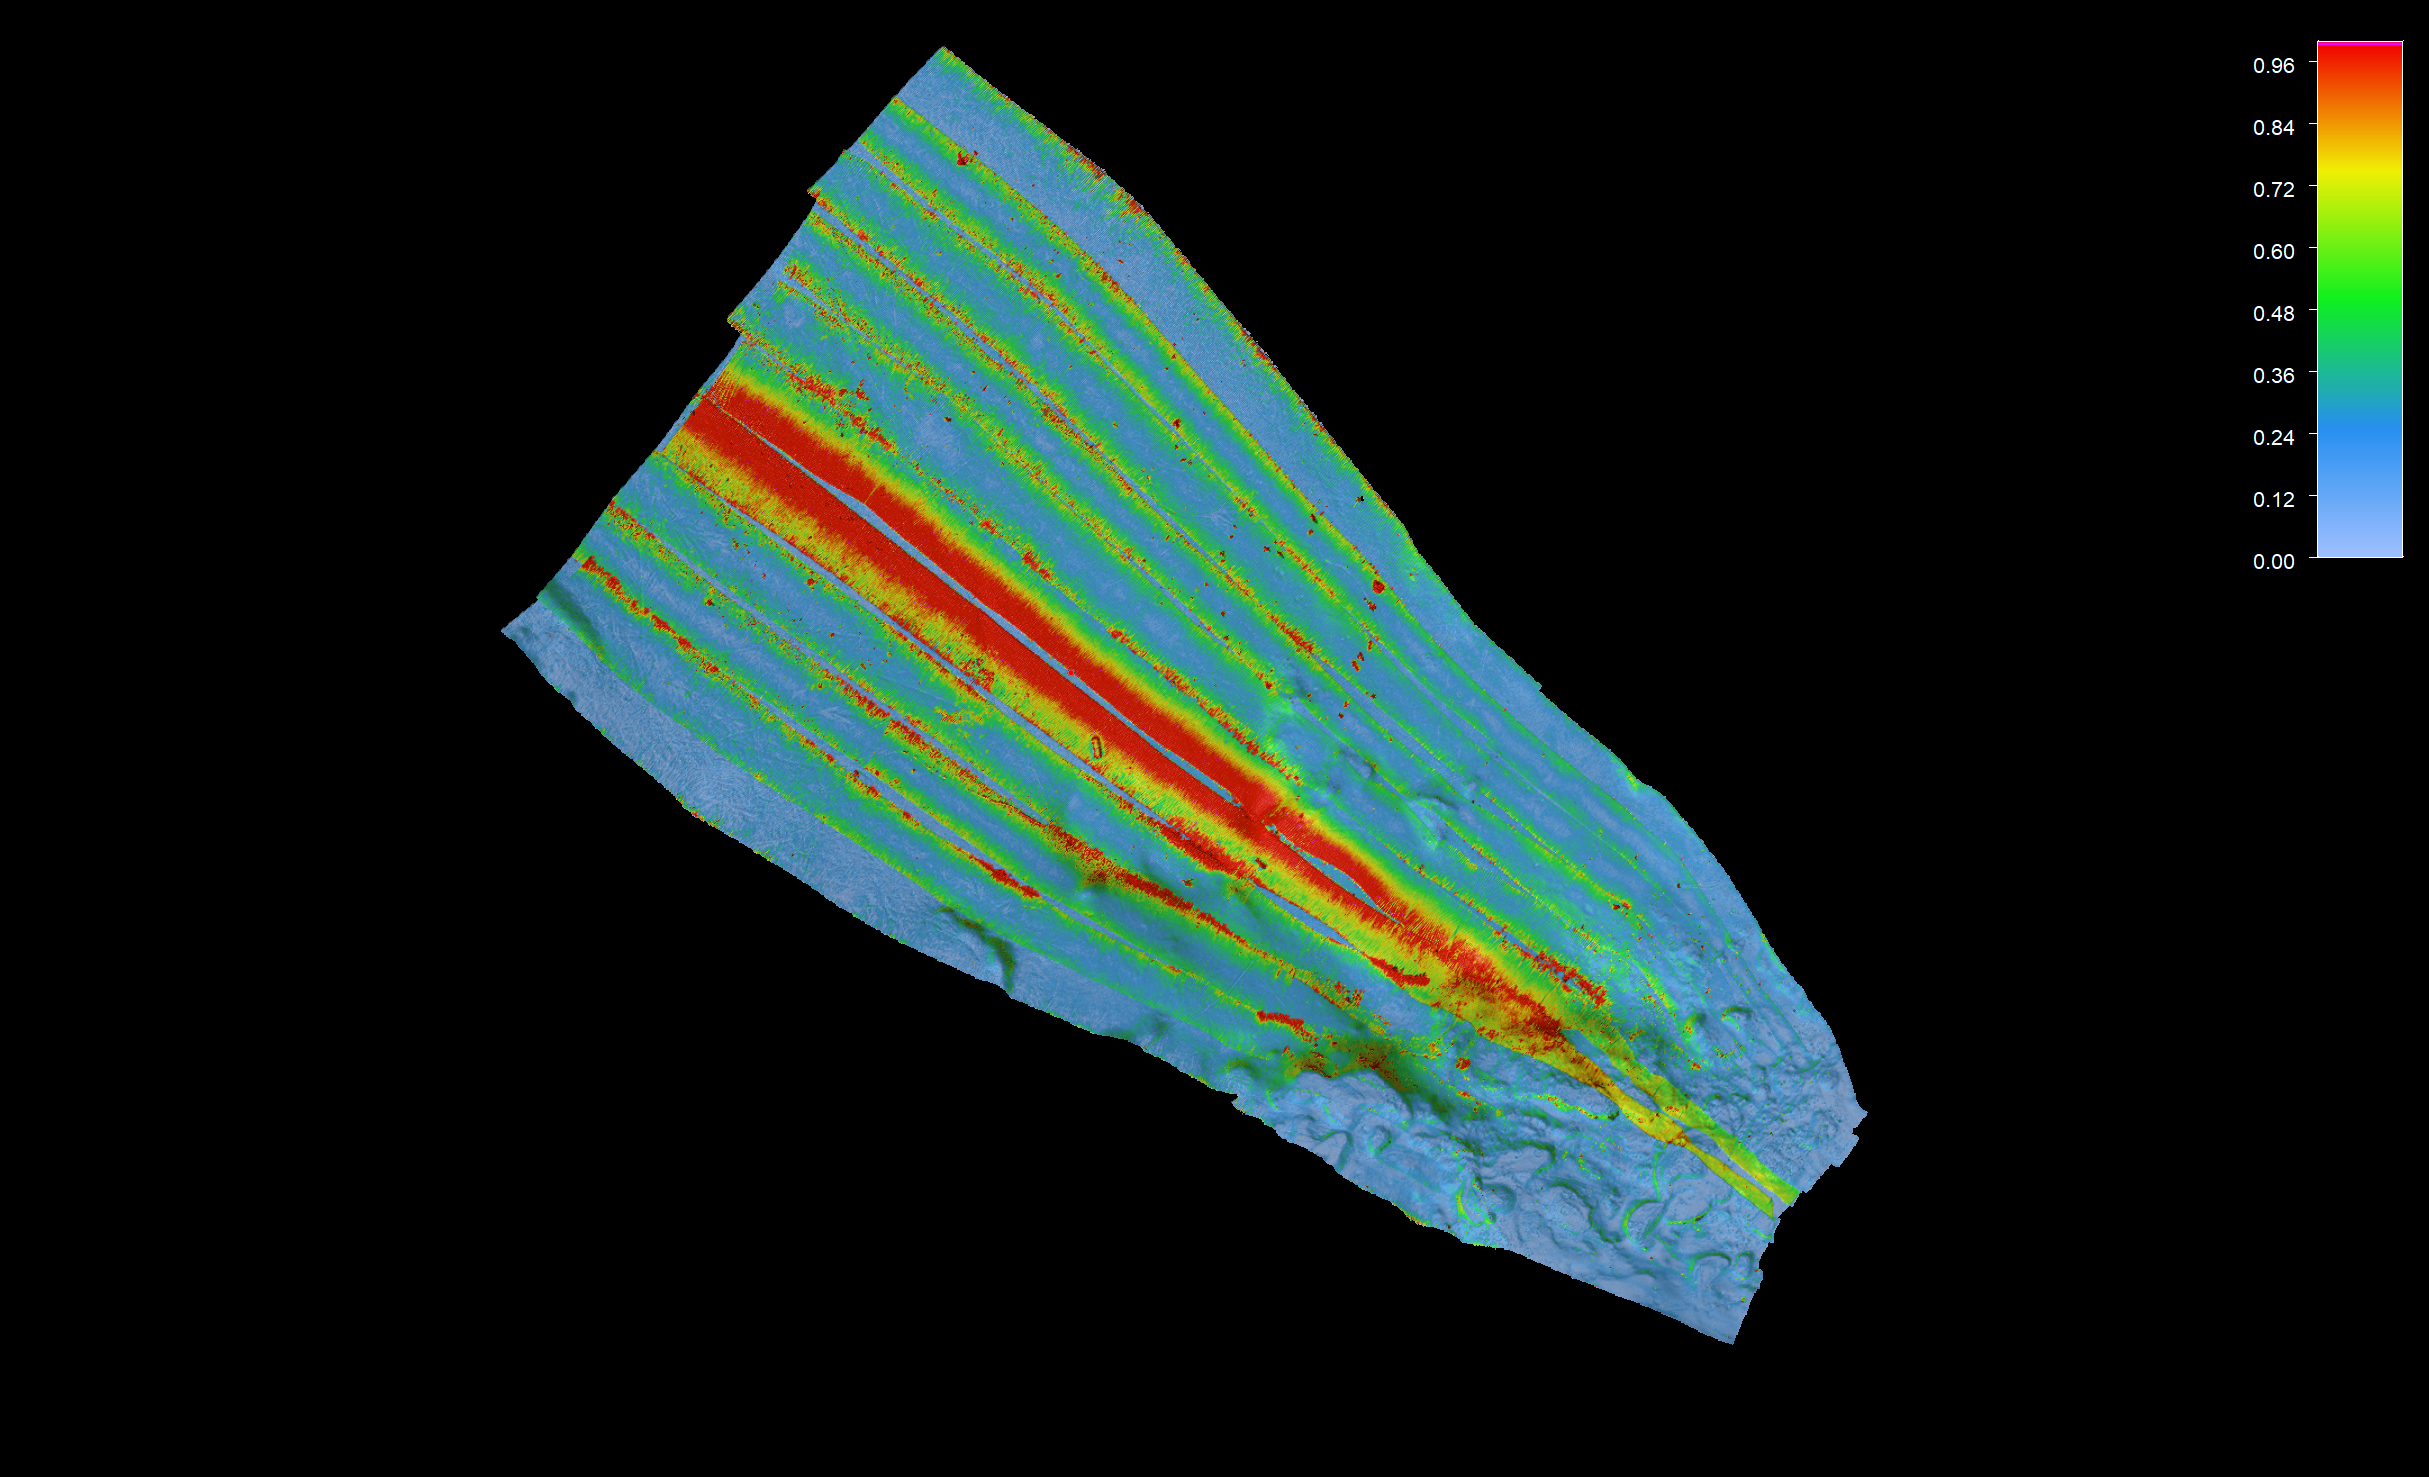
Part I - One survey line has no SBET applied, a Dynamic Surface was created for this one line. A reference surface was created with all other lines for which the SBET was successful. Coloring is by uncertainty, +/- 1.0 m.
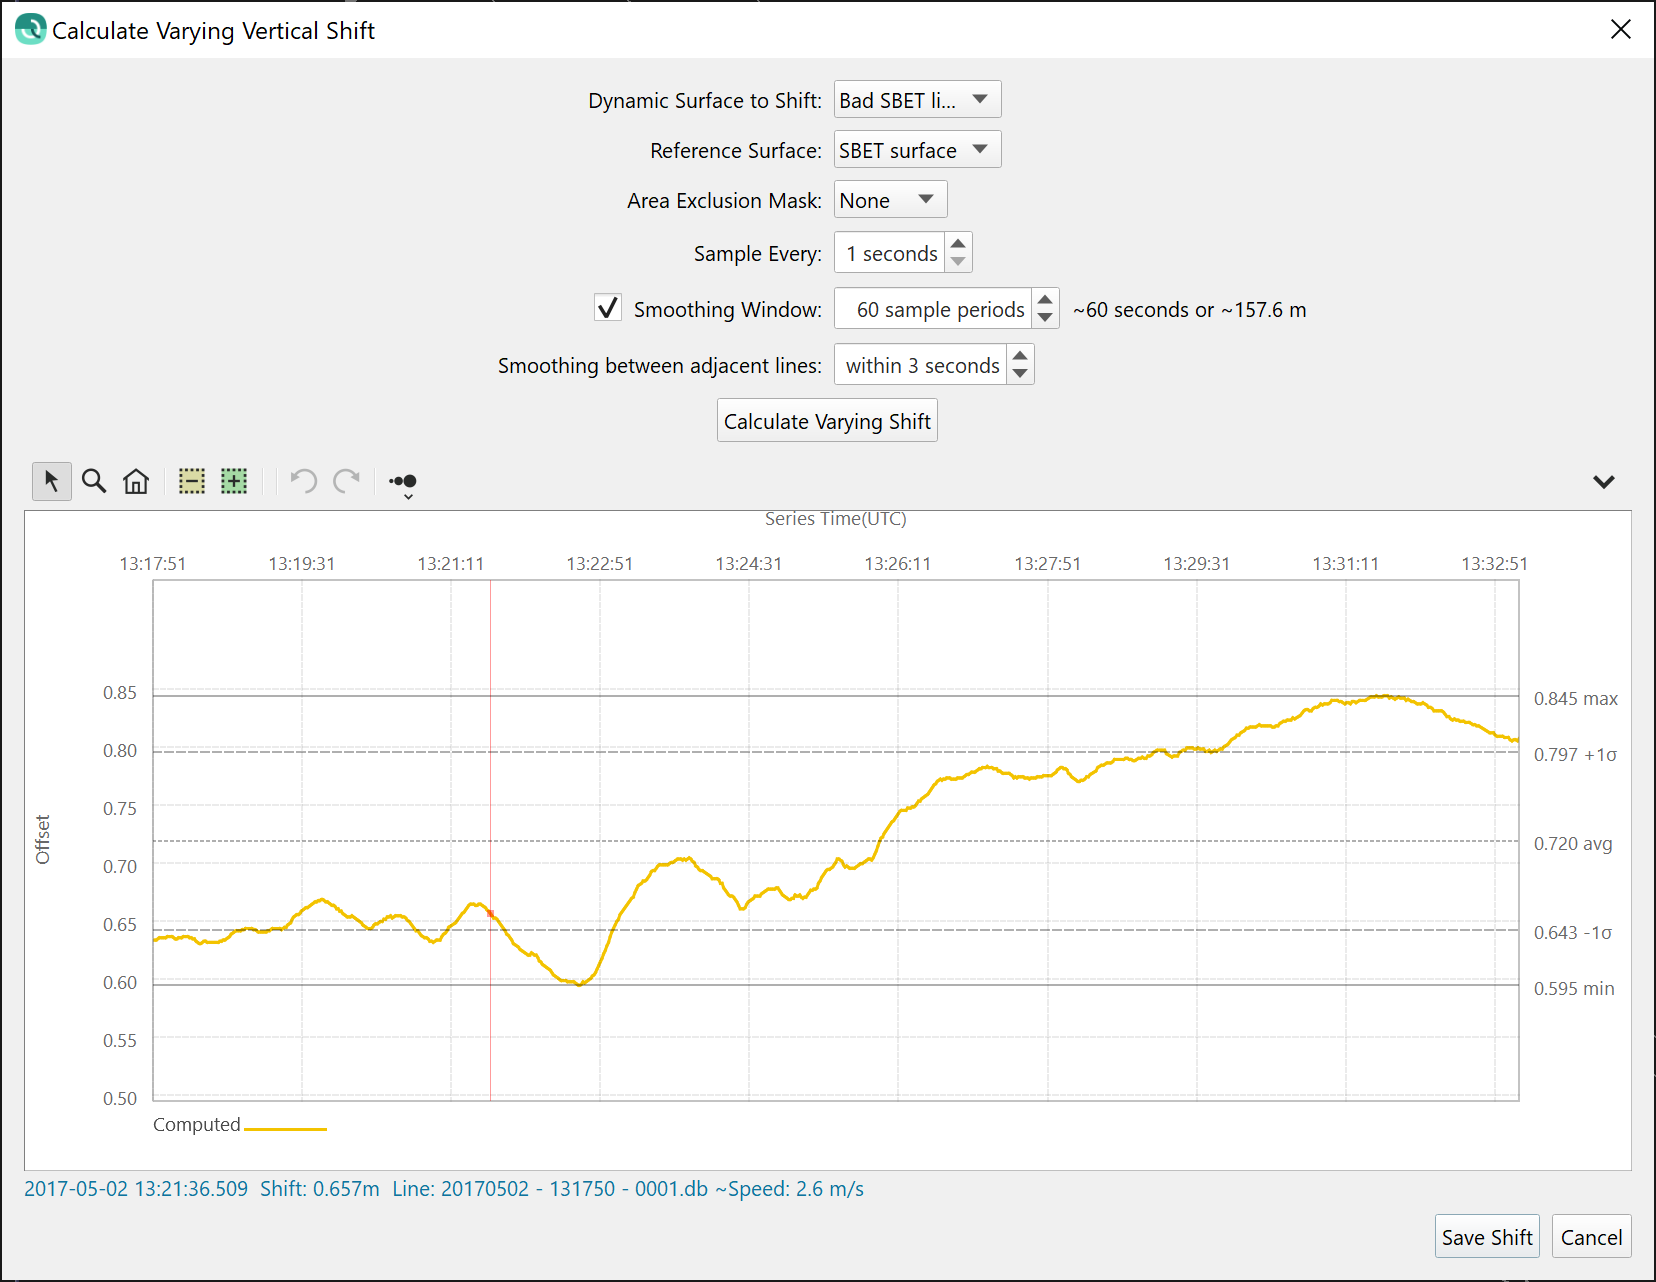
Part II - The Varying Vertical Shift Tool is run and a vertical corrector time-series is created for the survey line without SBET height. A 60 second smoothing was applied to ensure that only the low frequency tidal effects are captured in the corrector time-series.
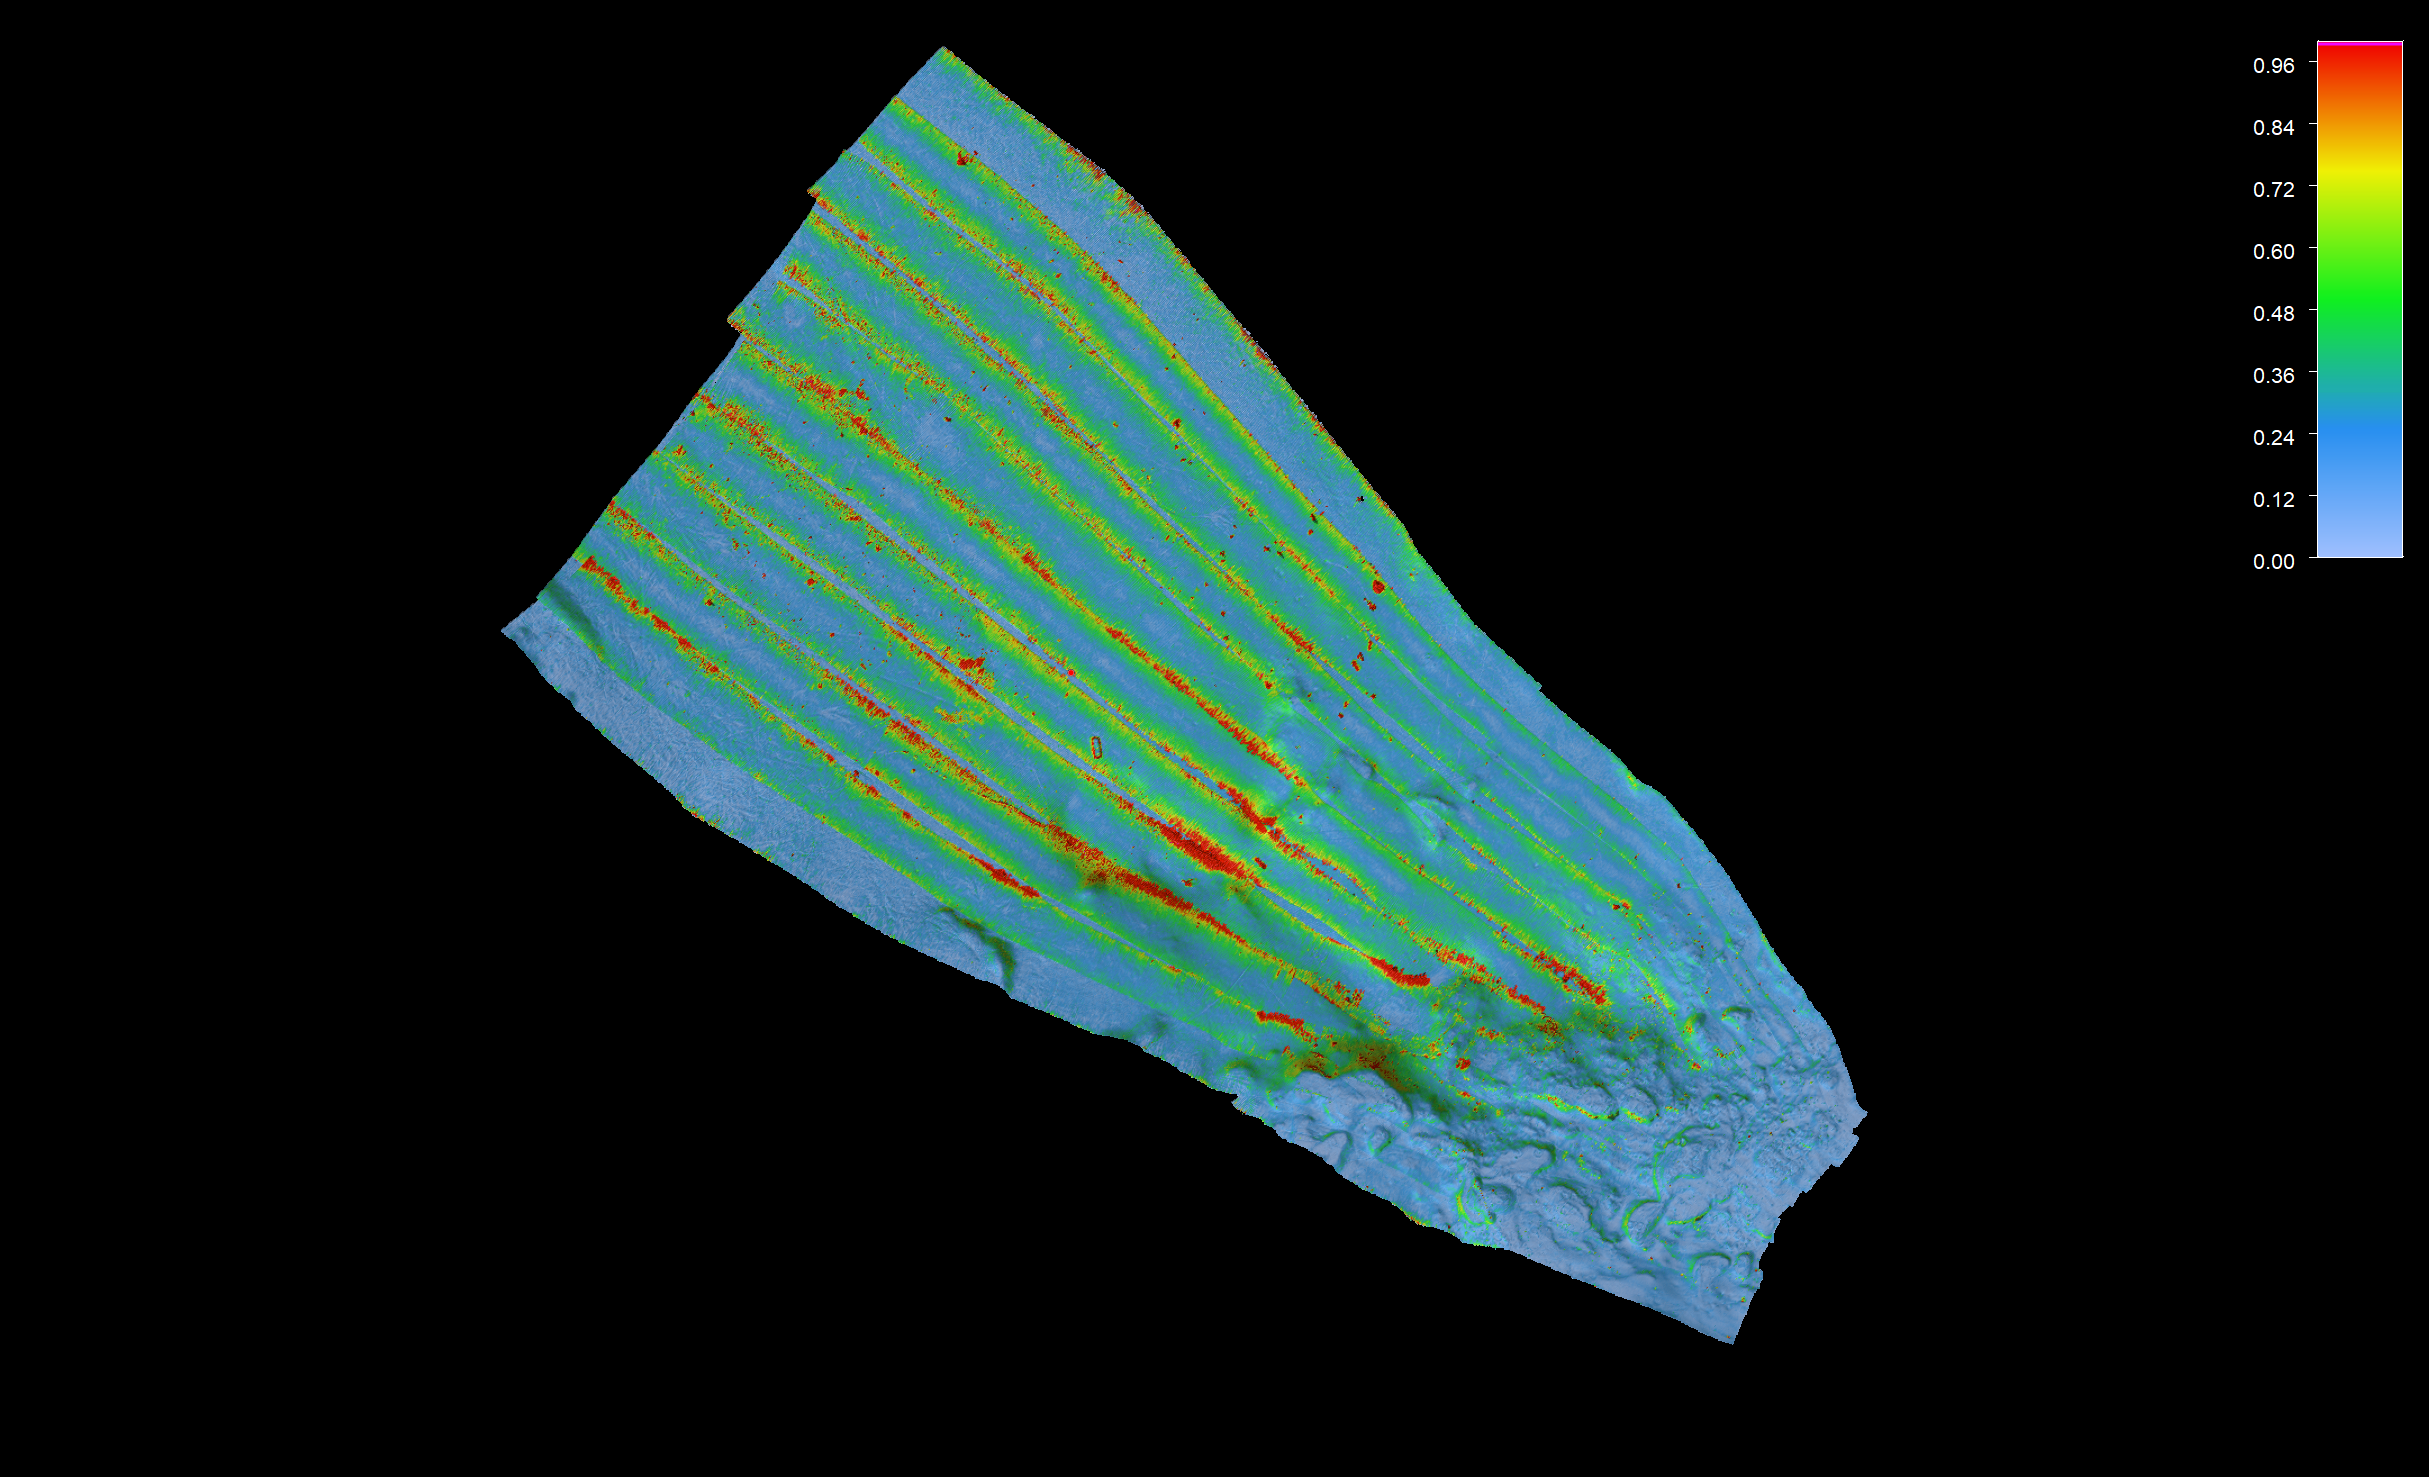
Part III - The vertical corrector was applied and the Dynamic Surface was updated to show the final effect: the long section of high uncertainty has been removed entirely, demonstrating that a reasonable height solution has been found to remedy the missing SBET data for the survey line.
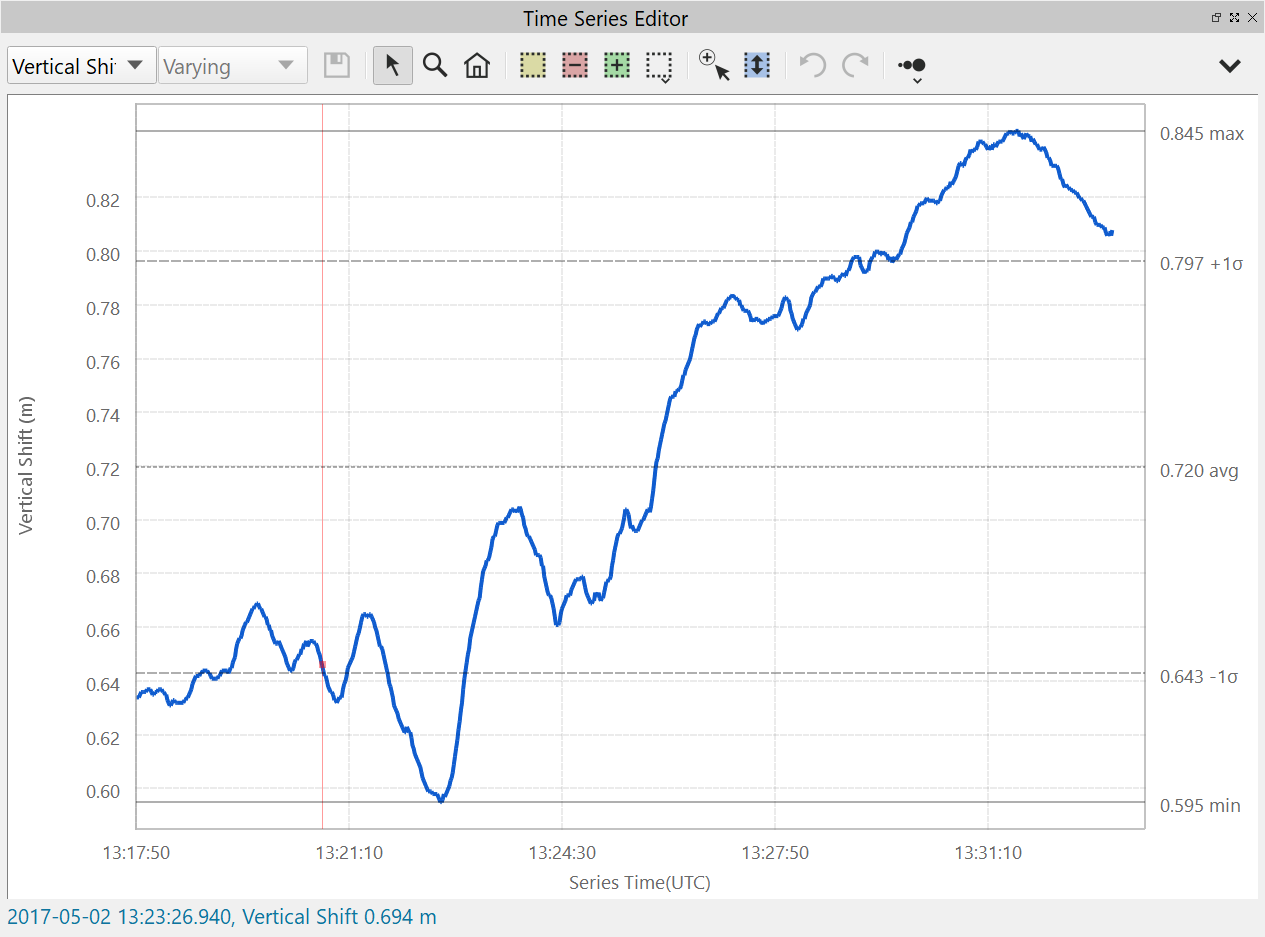
Part IV - The varying vertical shift for the survey line can be viewed in the time-series editor. It can also be EDITED using the existing tools, and can be very powerful when combined with the new time-series freehand interpolation, extrapolation and shifting tools.
You can select a line object in the scene to use as an Area Exclusion Mask. This will mask out areas you don't want to be part of the statistical computation. For example, if the primary survey contains rock dumping and the reference surface does not, you can mask out the area of the rock dumping which allows the algorithm to compute more accurate statistics.
The results are computed as a time-series of vertical shifts for all the lines that contribute to the Dynamic Surface, this is done at a fixed time interval and you can smooth the output as well within the tool. There is also the capability to allow for joins across survey lines along the route as long as the time gap between the lines does not exceed the specified tolerance for interpolation across a file boundary. These options are shown in the subset of the main dialog, below.
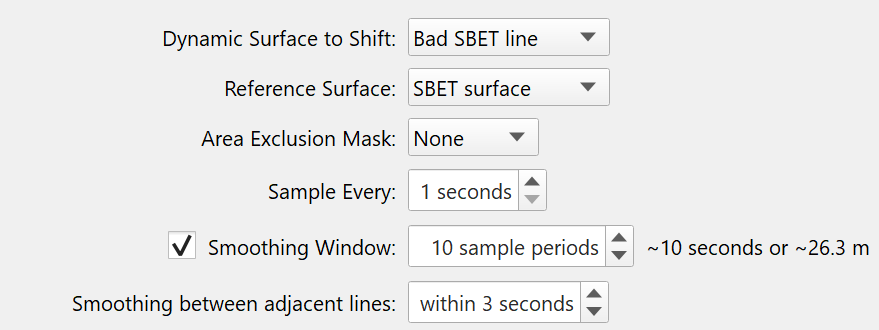
Once you save the results using the Save Shift button, the results will be stored for each file as a time-series of shifts that can be reviewed and edited in the time-series editor as a "Height Shift" time-series. Qimera will prompt you to reprocess the relevant files after you run the tool and every raw sonar file that is part of the Dynamic Surface you are shifting will have a continuous vertical shift applied on a ping-by-ping basis. Qimera will then prompt you to update all Dynamic Surfaces containing the affected lines. A statistical summary of each file's continuous shifts can be reviewed in the Processing Settings.
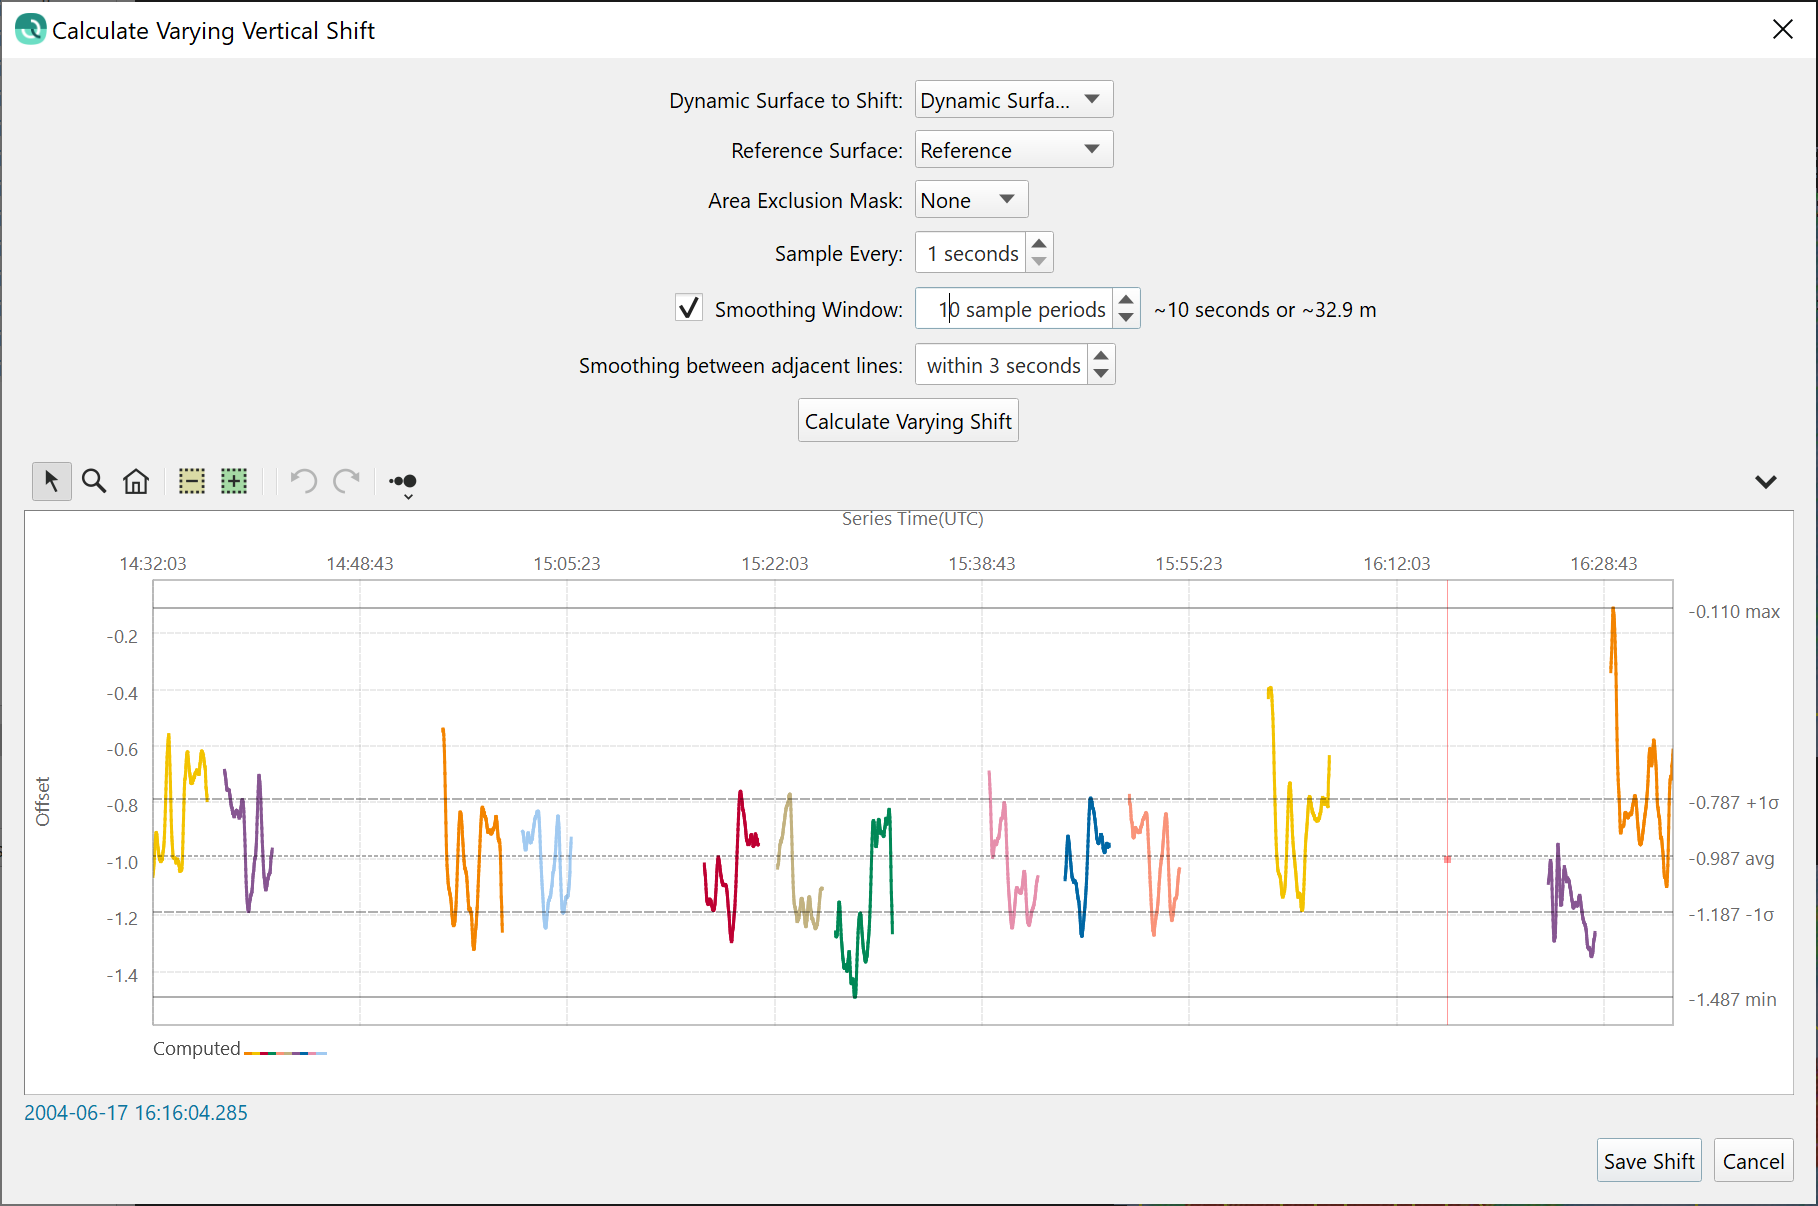
The tool can run with a Dynamic Surface that contains many survey lines as well, here's a view of the tool when many lines have their Dynamic Surface matched against a reference.
The Varying Vertical Shift tool can also be used to repair portions of a line for which the vertical referencing is poor from, for example, a short lived GNSS burst dropout. This is best done with the new time-series freehand interpolation, extrapolation and shifting tools as well to craft an optimal shift for the GNSS outage window.
Horizontal Shift Tool
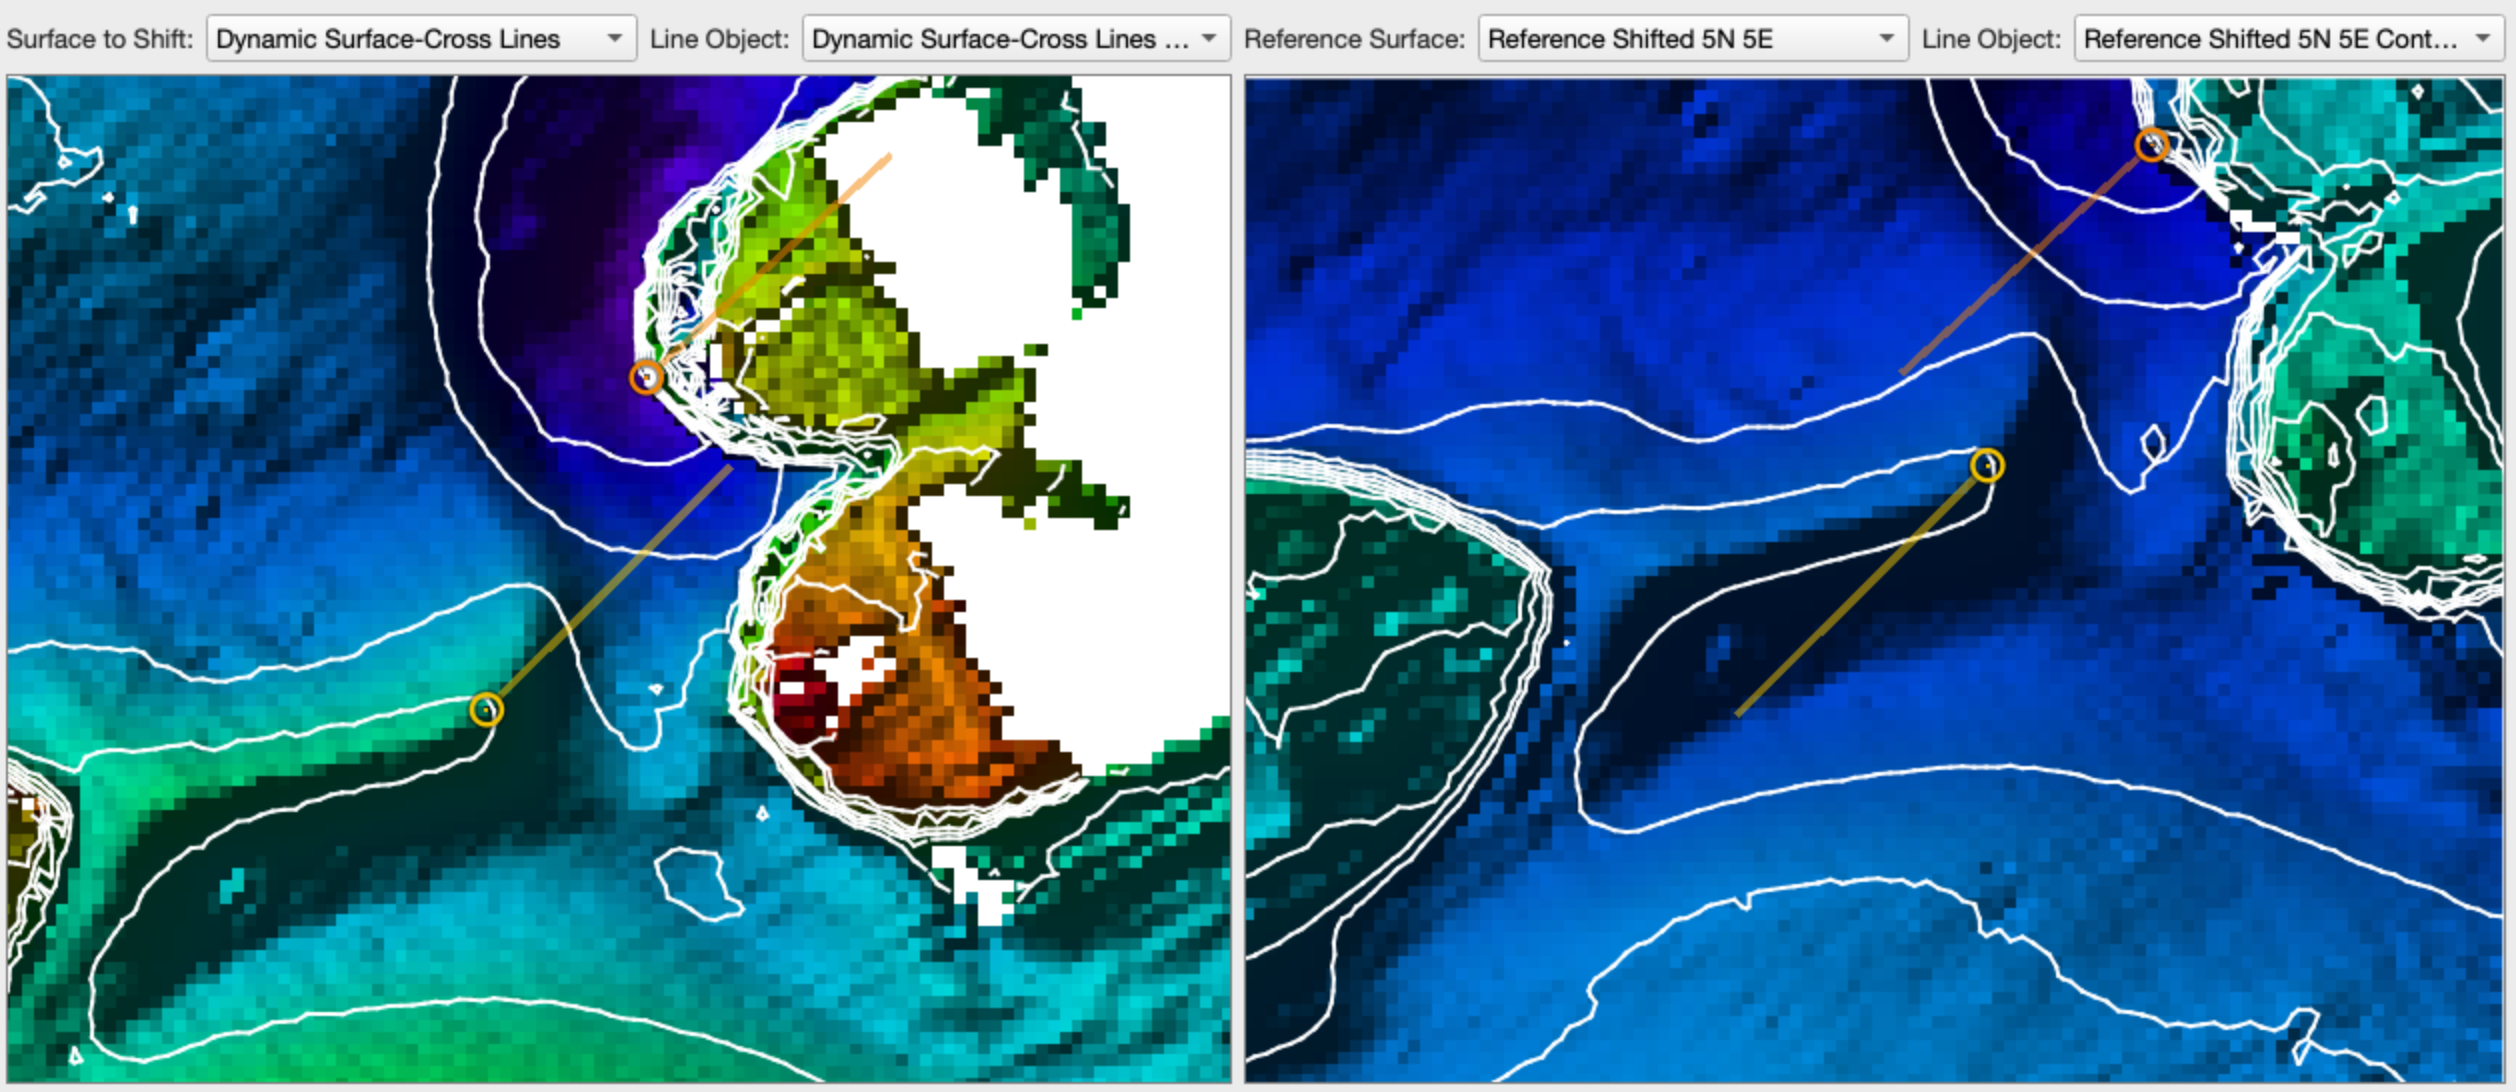
The Static Horizontal Shift Tool allows a user to align a Dynamic Surface from a survey to another reference surface that could be either a Dynamic or Static Surface. This type of tool is valuable for getting surface to match when one of the two surveys has a horizontal shift for whatever reason, this can occur with AUV/ROV missions for example. For this release, we allow for a single common horizontal shift to align surfaces, the resulting calculated shift is stored as a Processing Setting for the contributing raw sonar files that can be enabled/disabled.
The user does this by selecting a number of corresponding matching point pairs on each surface, which are referred to as fiducial points. Qimera will then compute an average XY offset between all fiducial pairs that can then be applied to the raw sonar files of the Dynamic Surface the user desires to shift. Typically, the user picks corresponding features on the seabed or corresponding features of line objects such as contours to use as fiducial points. The user can pan or zoom around either surface view and the same corresponding geographic location will be at the center of the view when the views are "locked". The average XY offset is computed by averaging the XY displacement of all fiducial pairs in the Point Table. As you register fiducial pairs by clicking on like features in each window, circular icons appear that represent the location of each pick.
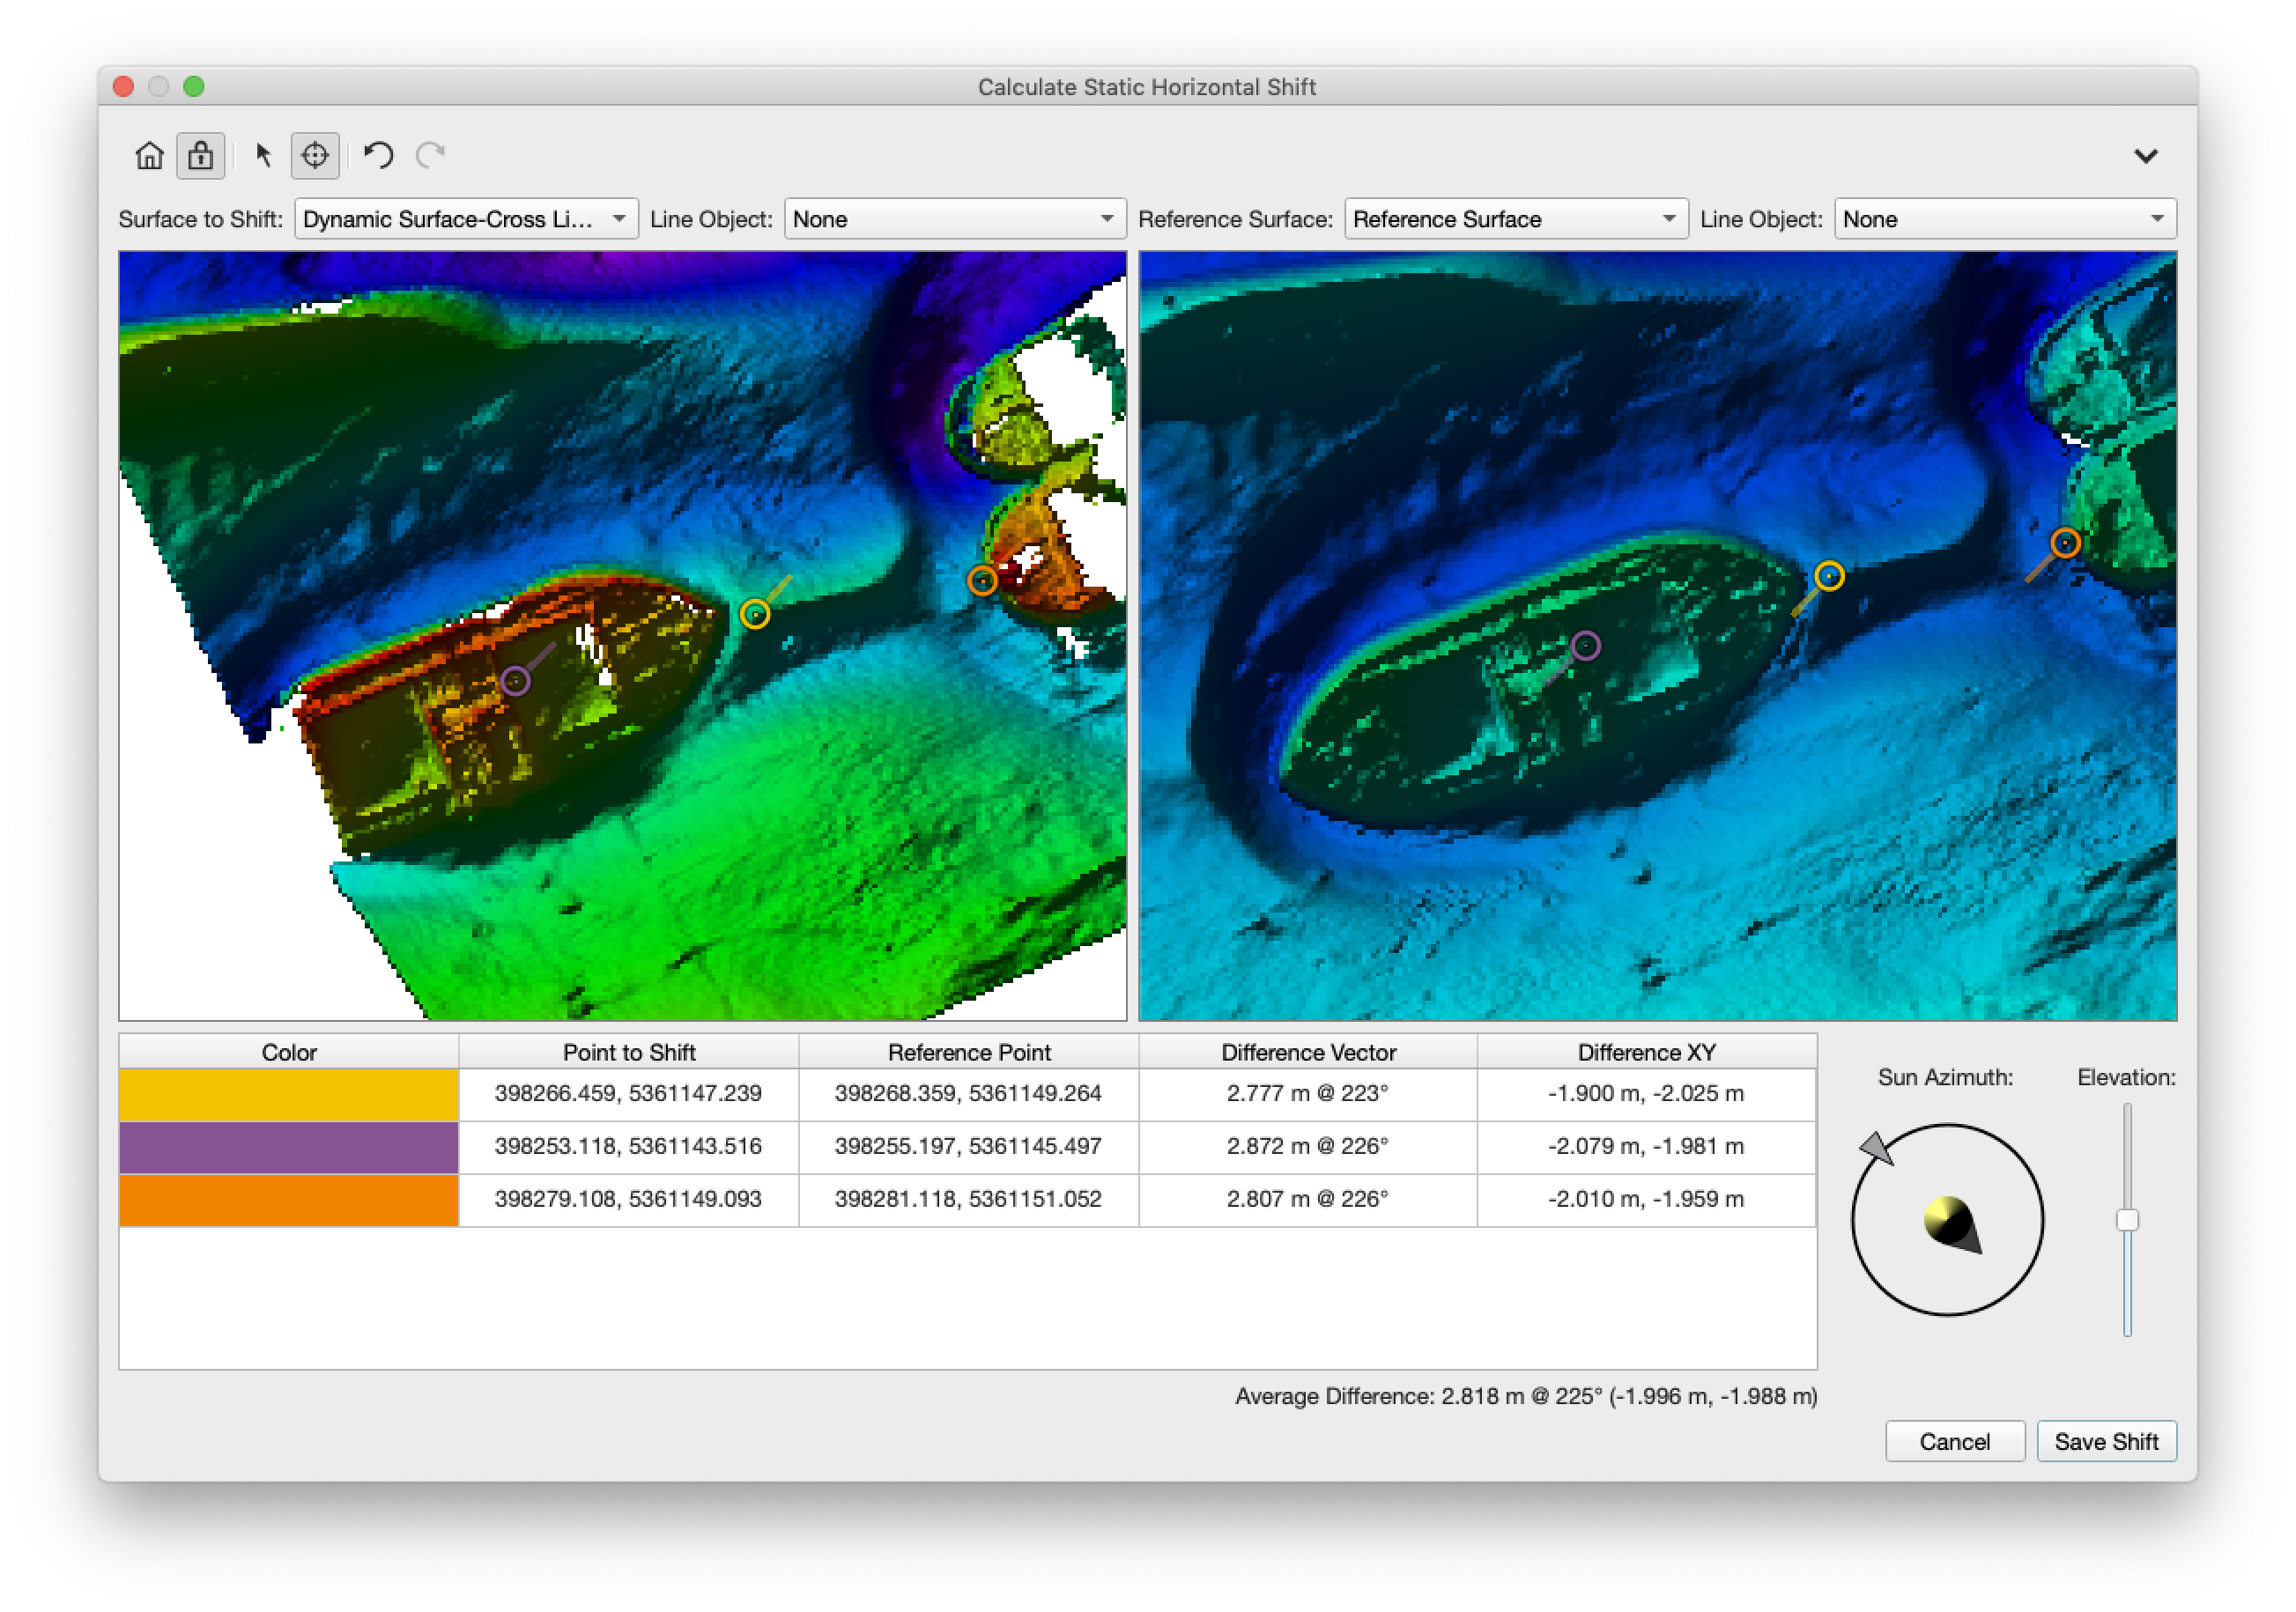
Dynamic illumination controls allow you to change the sun azimuth and elevation to highlight features on the surface. In the event that features aren't readily visible on the surface, you can also prepare contours of each surface and have these displayed as well to assist in identifying common fiducial points.
Static Vertical Shift Tool
This tool allows users to shift a Dynamic Surface, and the contributing QPD point cloud files, to a reference surface with a single shift for all files. This type of tool is useful in situations where your survey data must be made to vertically align with a reference surface that has a constant vertical mismatch. This can occur when matching a ROV or AUV surface to one from a surface vessel. It could also be used to recover from an error in vertical referencing in either your new surface or in the reference surface. The shift is preserved in the Processing Settings for the contributing files and can be reviewed, reported and reverted with ease.
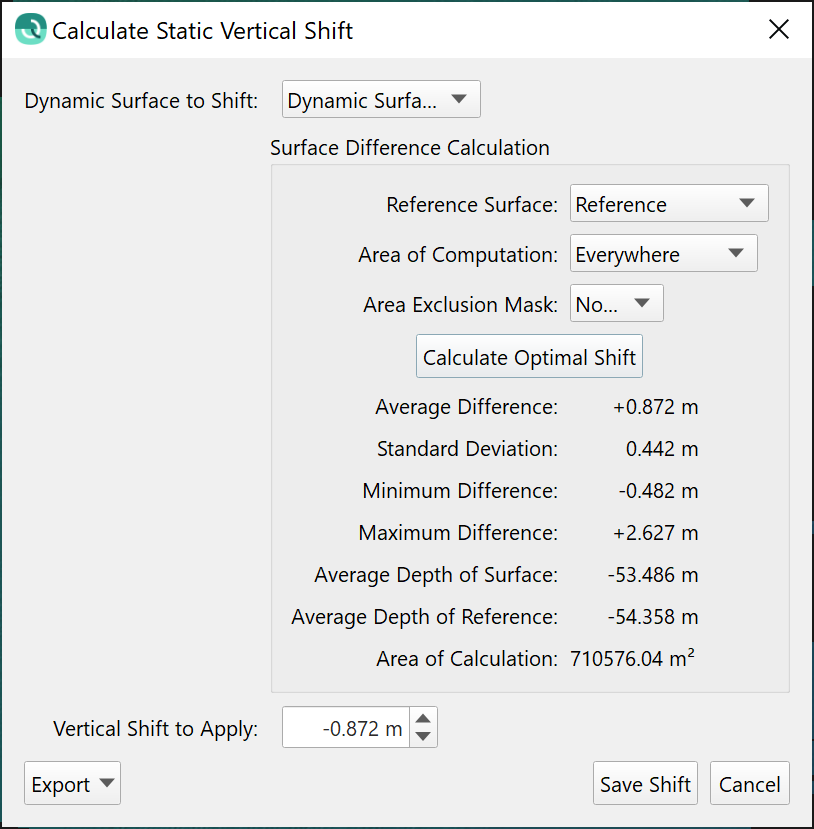
The shift is the average z-shift between the two surfaces, similar to what you would see with the surface differencing tool. The value added with this tool is that the shift is computed and then applied in the processing settings automatically for you with the correct sign convention, avoiding user error and streamlining the process. You can also set an Exclusion Mask, which is a set of polygons that prevent the use of particular areas for calculations. You can also set the Area of Computation to force the calculation to only investigate a specified area on the surfaces.
Processing Settings
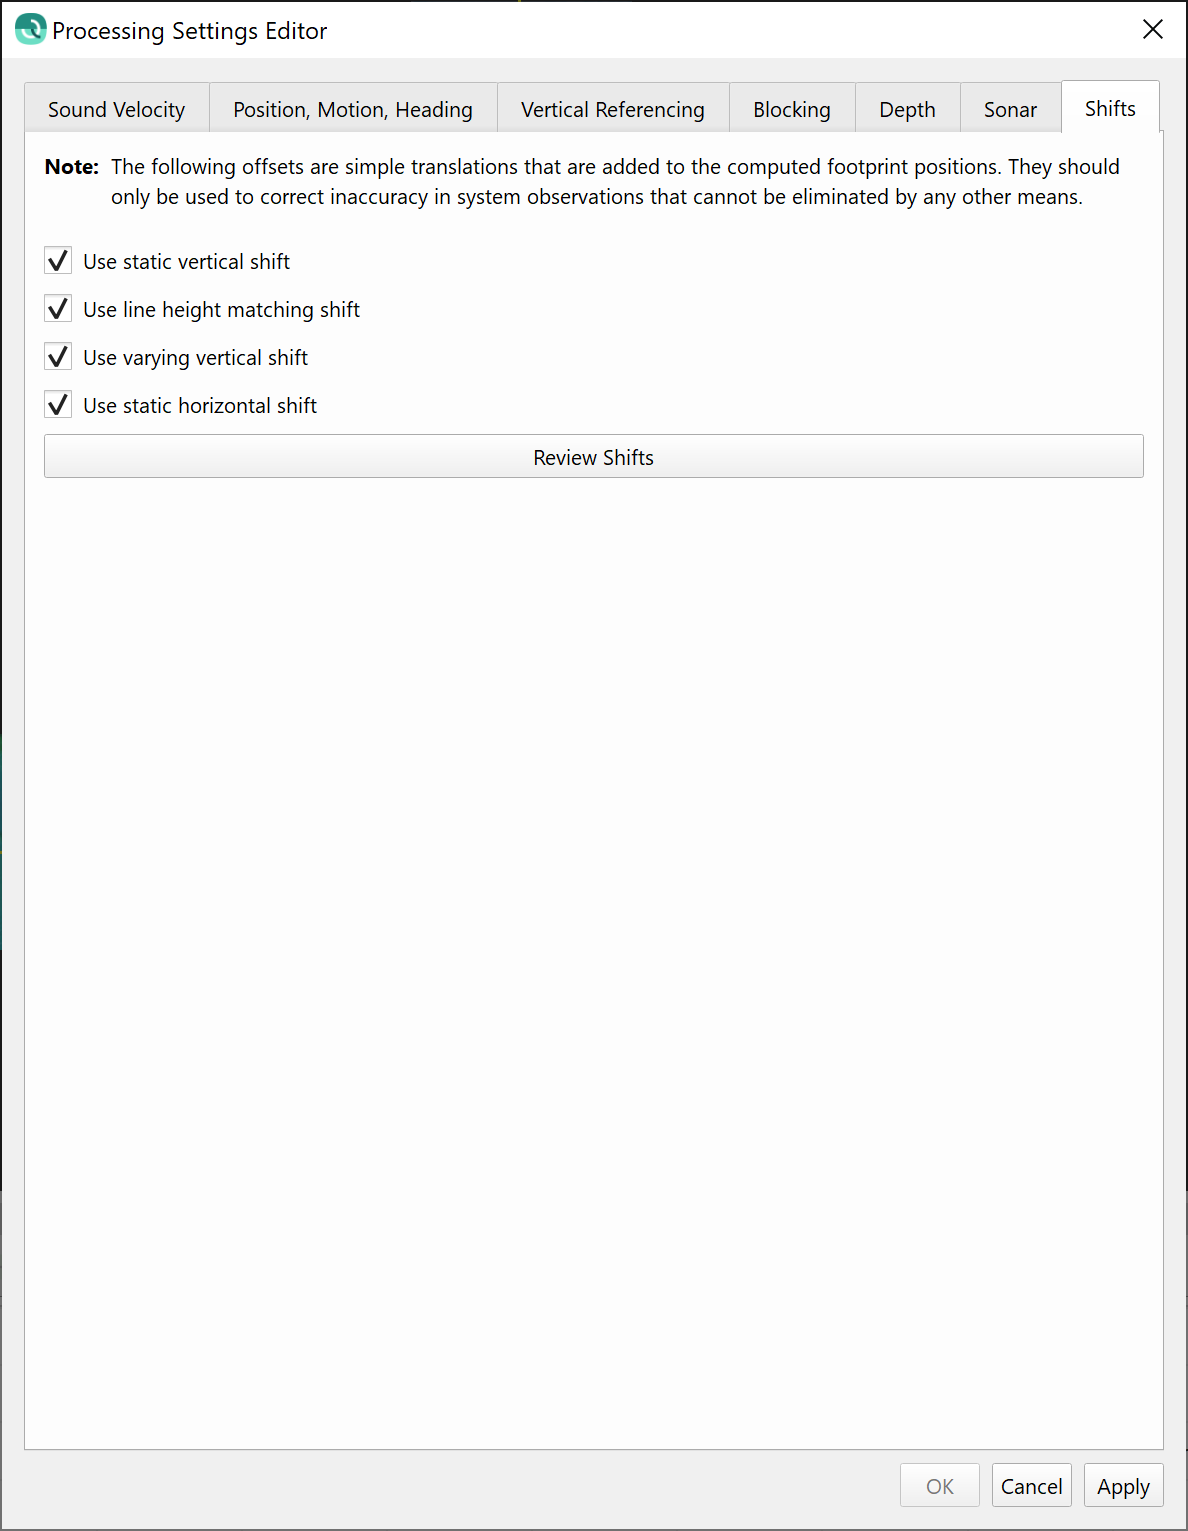
As mentioned earlier, you can easily verify, enable and disable all of the results from these tools. This is controlled by a new tab in the Processing Settings, as shown below. You can quickly review which tools have been run for which files.
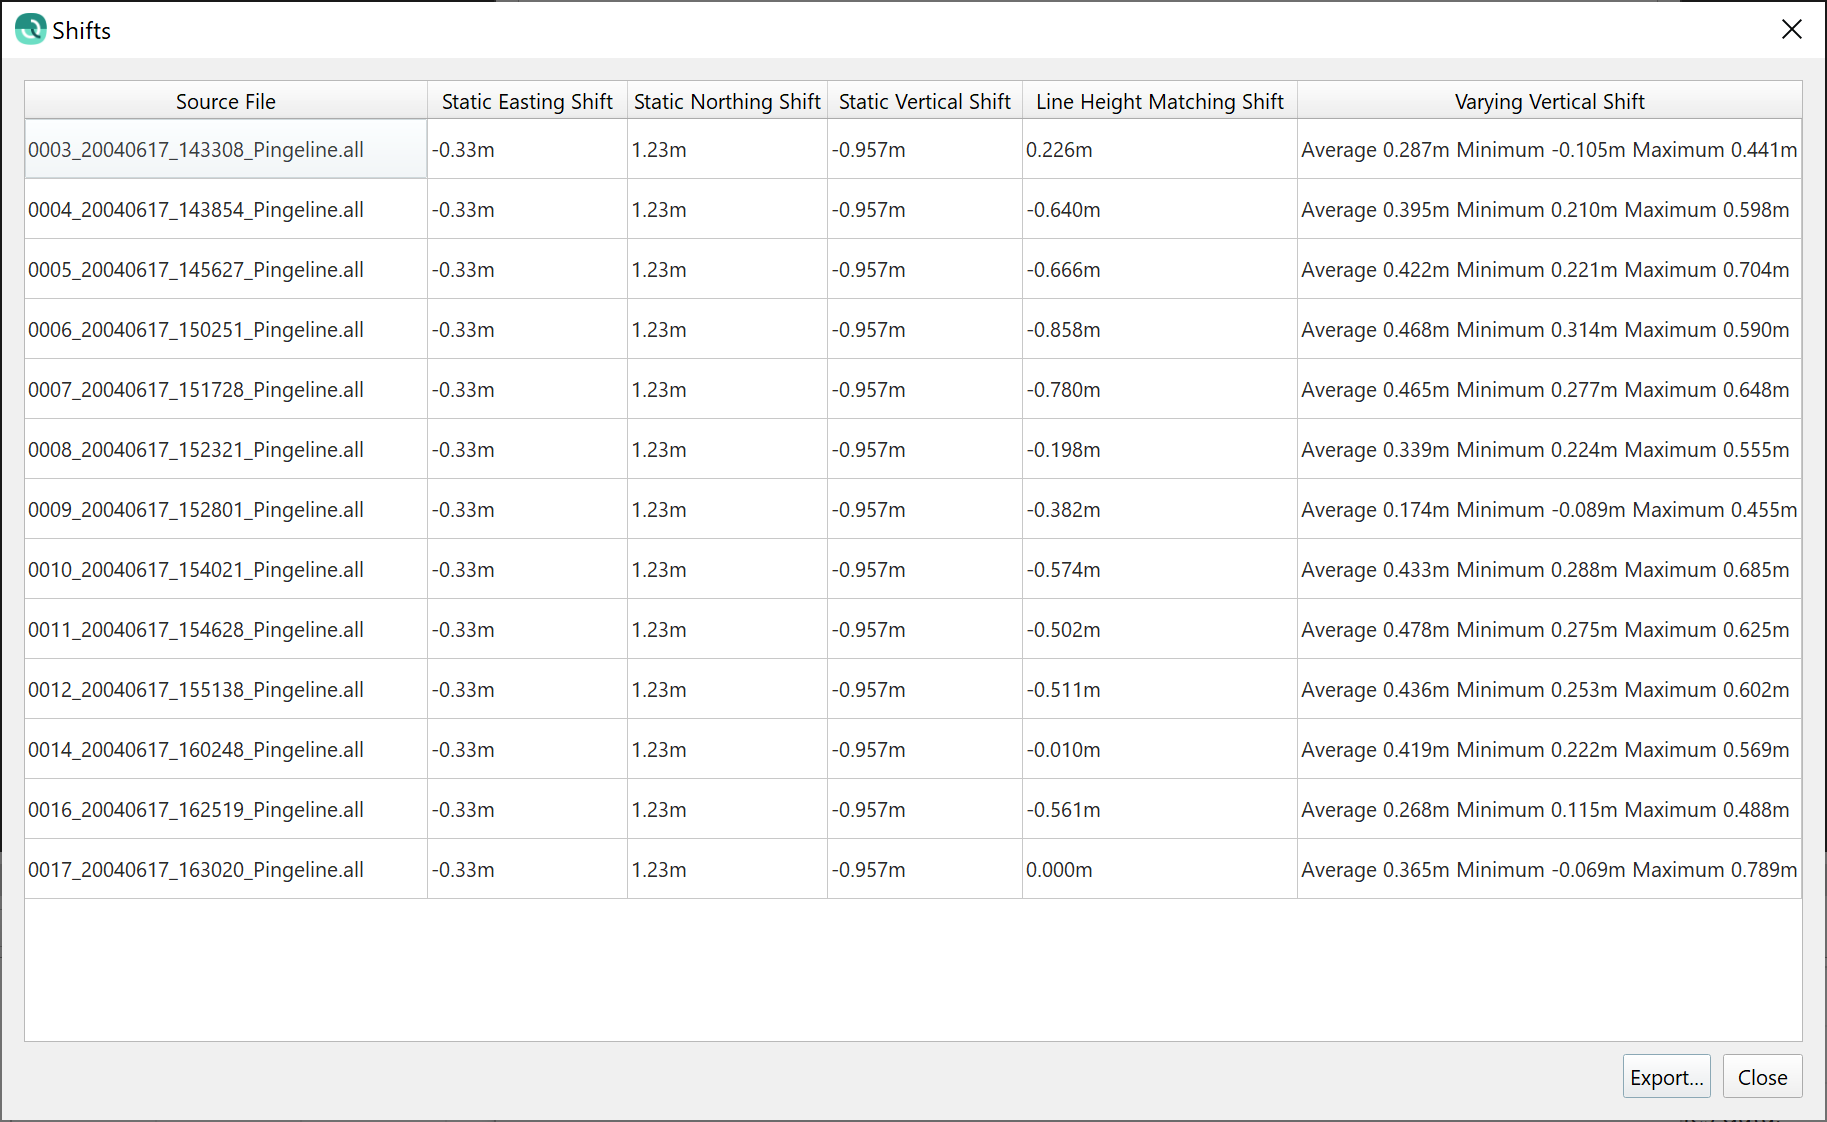
You can also review the shifts on a file-by-file basis from the Processing Settings dialog for the files that were selected prior to launching this dialog. The table below is an example of a data set that unfortunately required use of all of the shifting tools, including the line height matching tool that was released in Qimera v2.2. The summary table contents can also be exported from the same dialog for reporting or auditing purposes.
Time-series freehand tools for shifting, interpolation and extrapolation
In this release, we have added new functionality in the Time-Series Editor tool, inspired by similar tools in Qinsy's Validator and Analyse apps. The two main new features are the ability to freehand interpolate/extrapolate and also to select and shift a subset of a time-series. Both of these actions are captured in the time-series metadata such that you can report on user modifications in exports, there is also a new option to revert to the original time-series in the context menu in the event that you want to later undo all of the save edits, interpolations, extrapolations or shifts. Of course, while editing these actions are covered by the undo/redo functionality so it's safe to play with them a bit to get a feel before saving your changes. At the moment, these new features work for non-navigation sensors, a navigation editor is planned for a later release. These new tools, however, CAN be used on height time-series data, which is where they're most often required.
The new freehand draw mode lets you insert points at the beginning or end of a time-series for those cases where a small extrapolation is necessary. You can also insert points within the time-series but only at the sampling time of existing points and after removing the existing points using the existing edit functions.
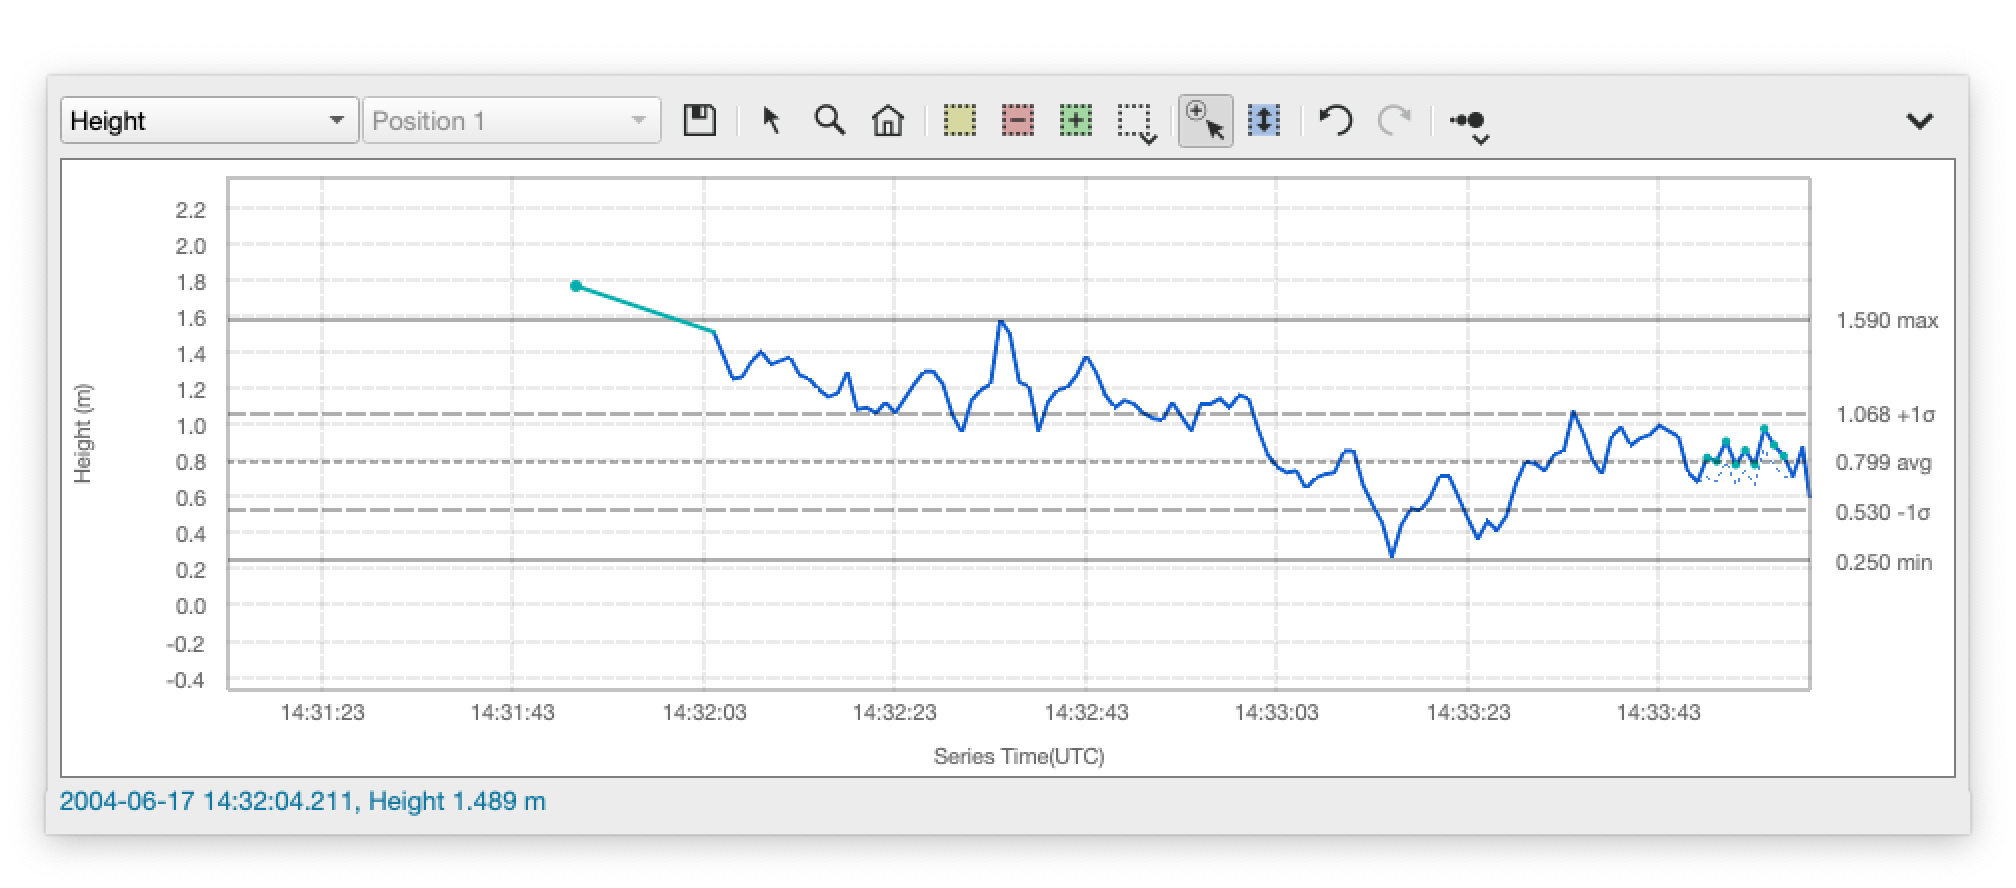
You can also edit a bad sequence of data and draw in a freehand replacement with the same mode that is used for extrapolations. To keep the design simple, you can only replace a value at the moment of time that an actual observed value occurred. The image sequence below demonstrates.
Here is the starting image, showing raw data with noisy values on the right side of the graph.
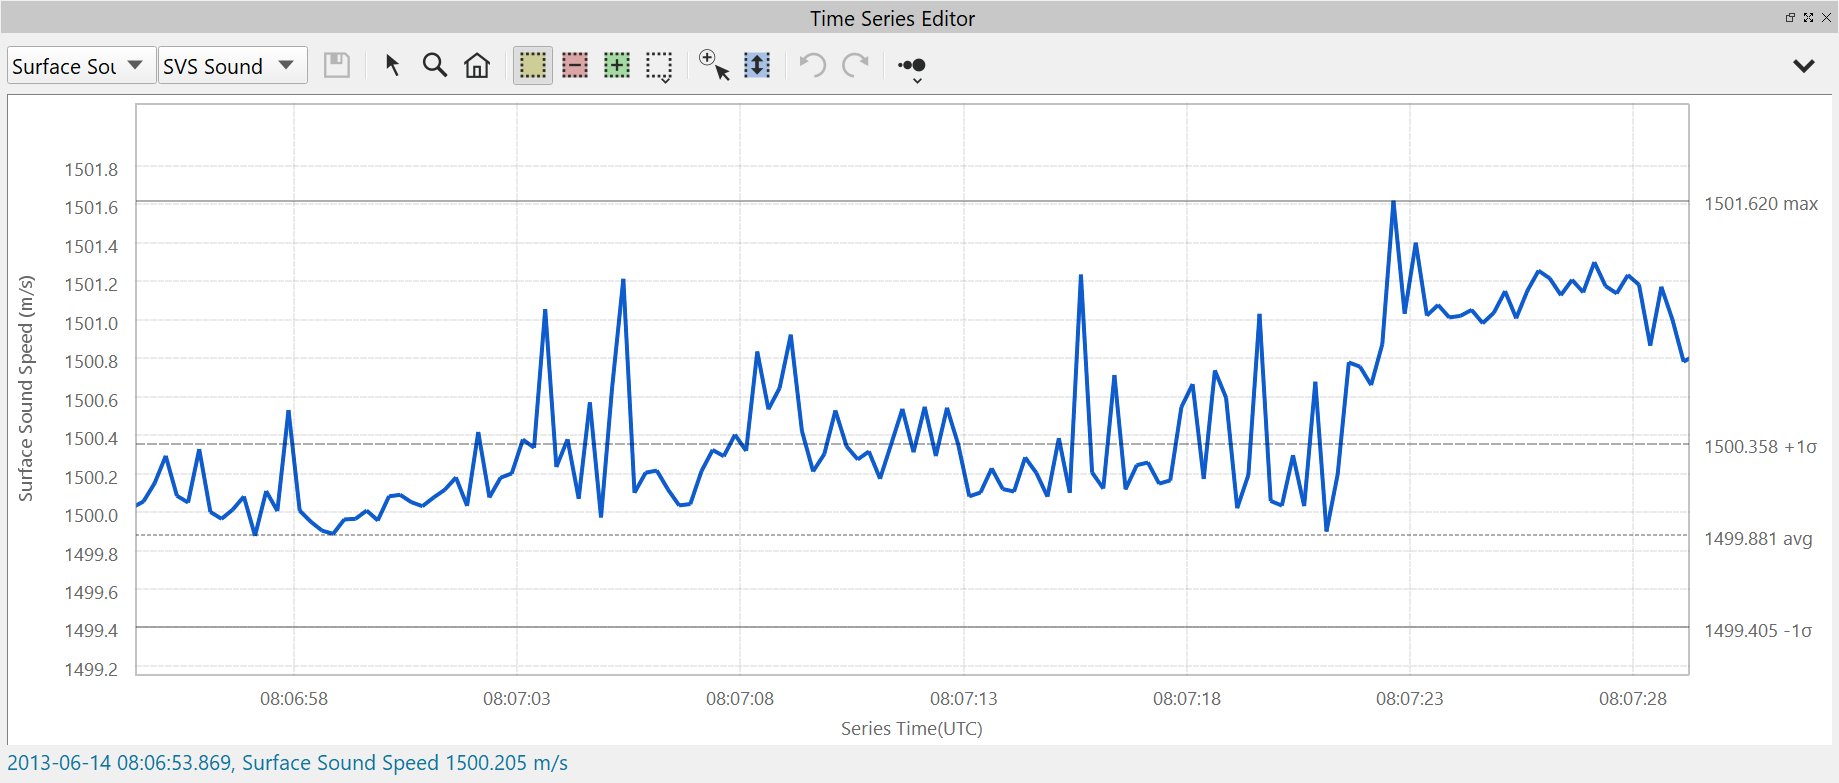
You start by editing the observations you want to ignore. It's best to use the reject with interpolation mode to prevent fall through to a backup time-series.
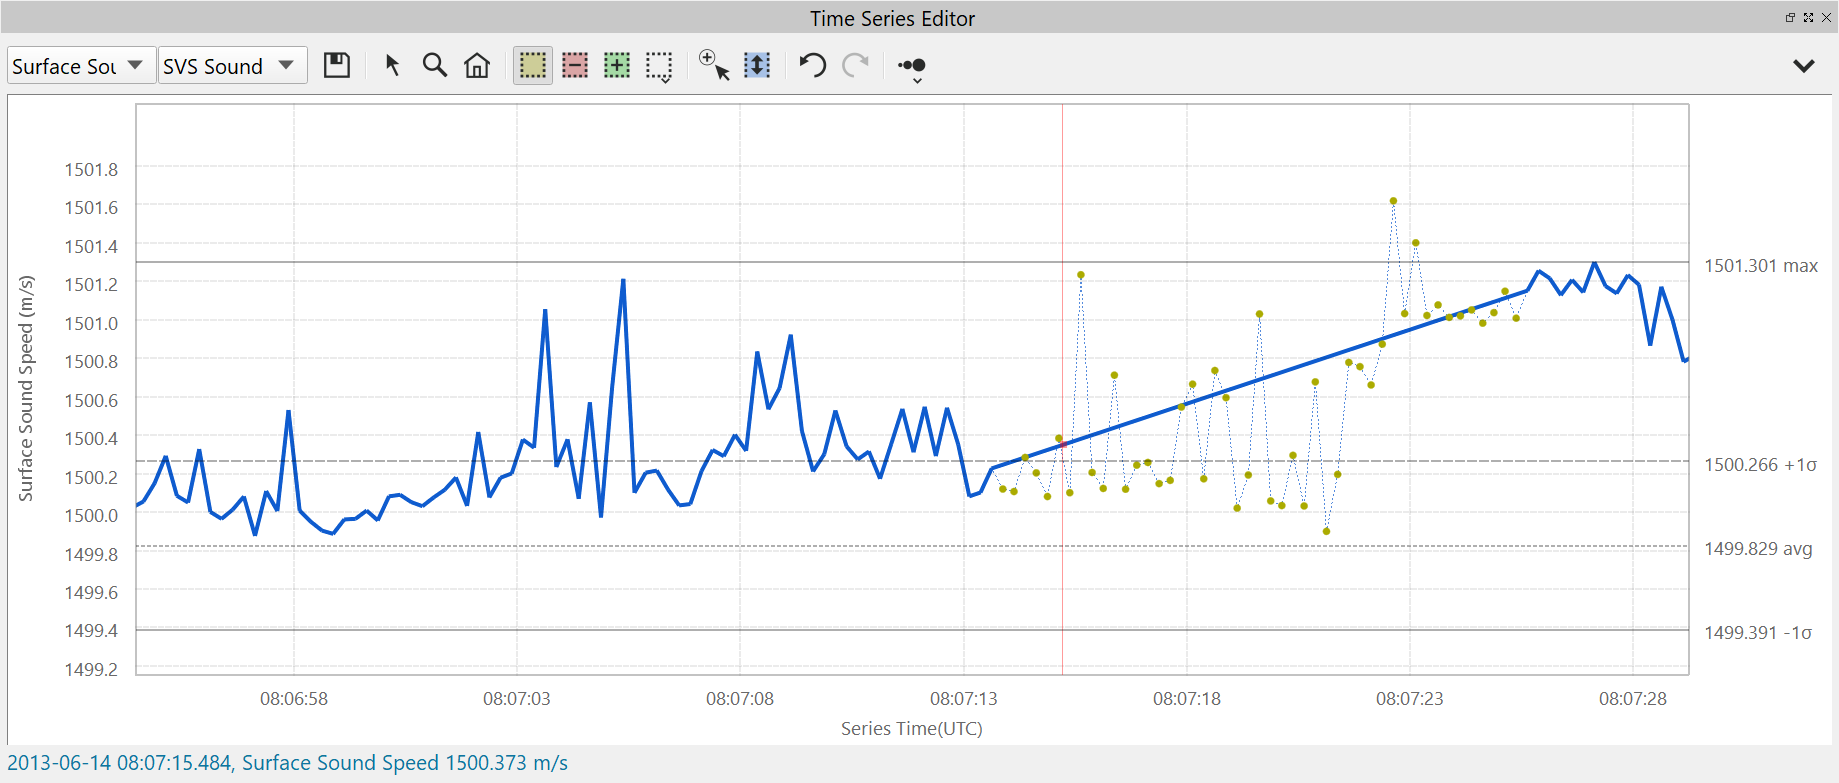
The switch to the new sample insertion mode and freehand draw the samples that you want to fill the gap to capture the desired trend.
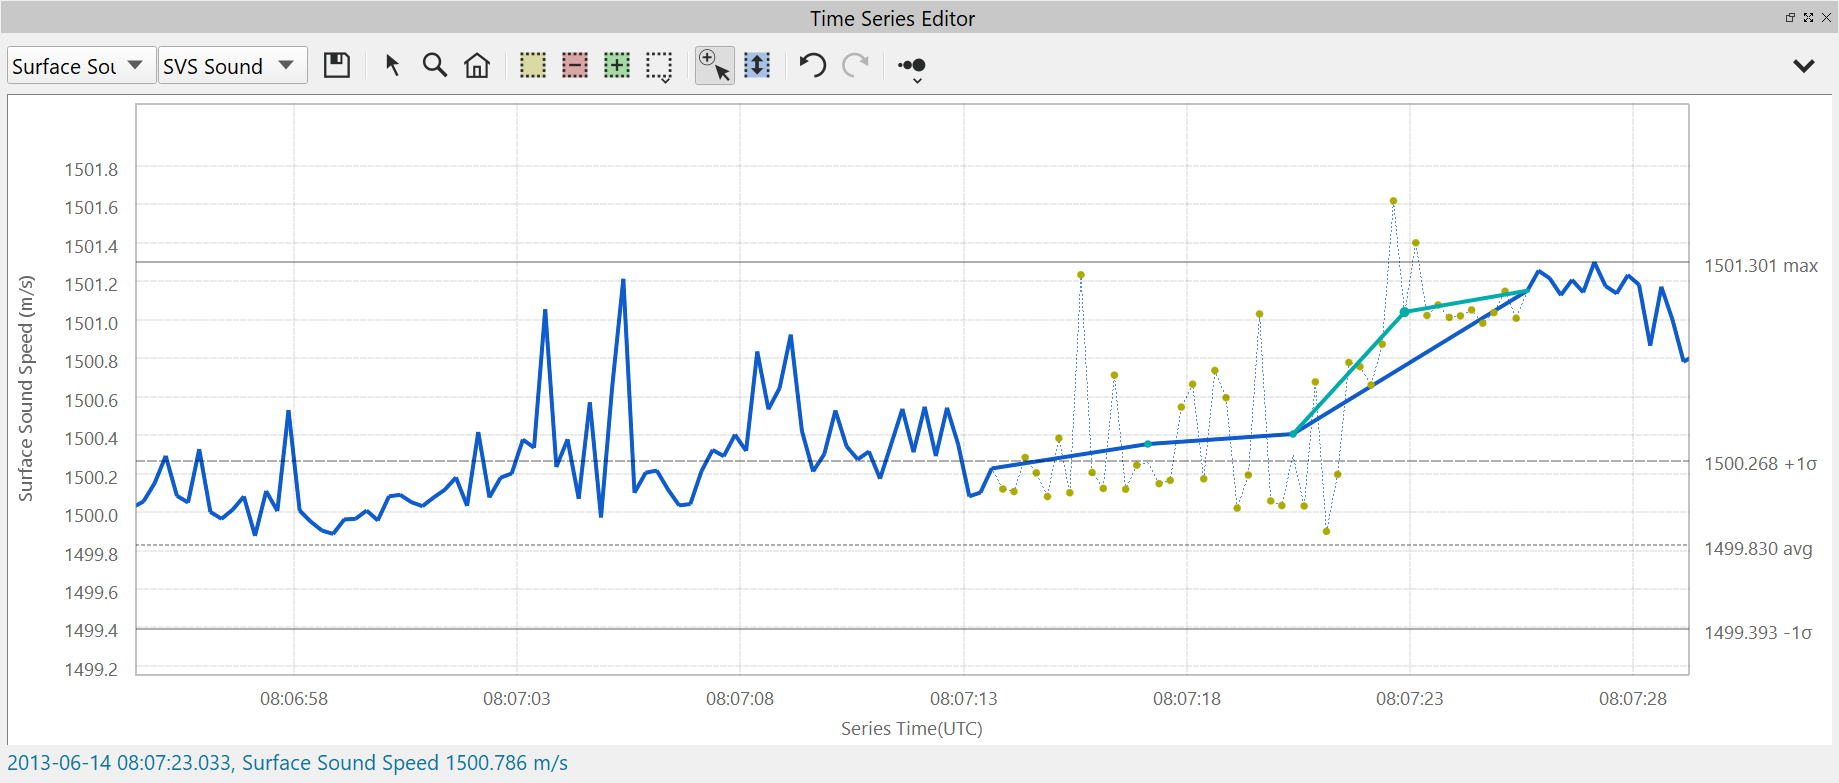
The new shifting mode allows you to select a span of the time-series for shifting. In the images below, you'll see a selected span colored in cyan, and immediately below the same section is shifted vertically.
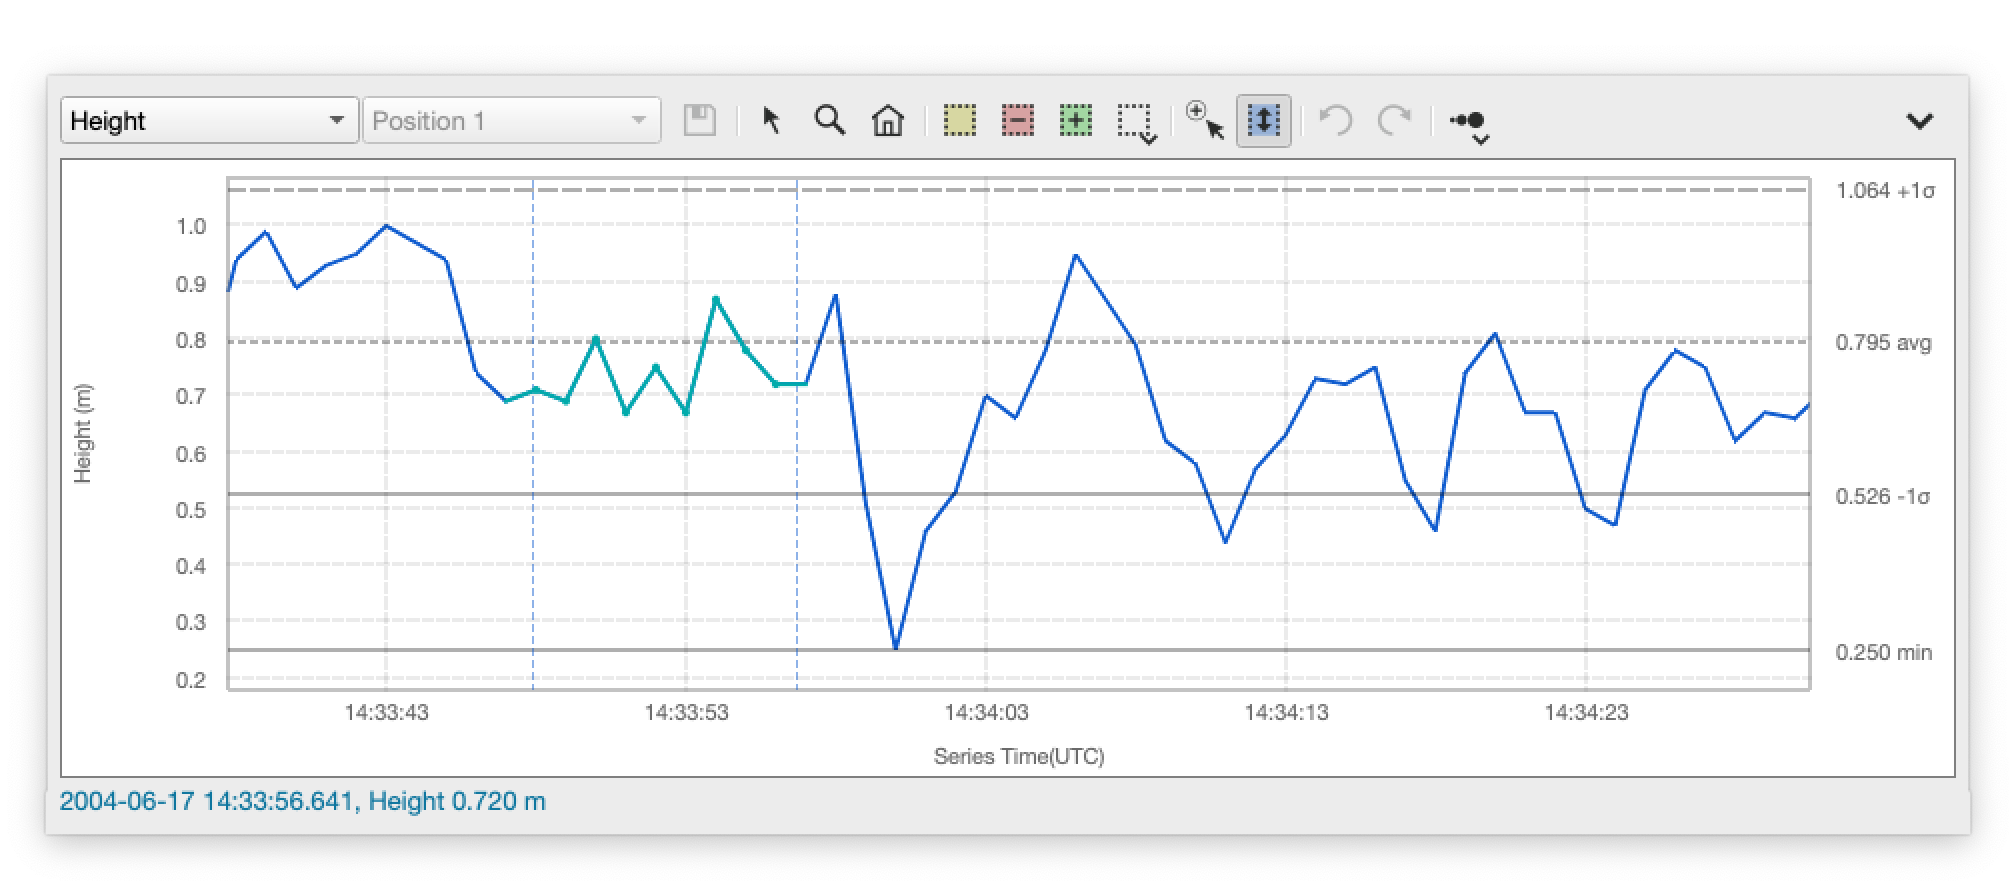
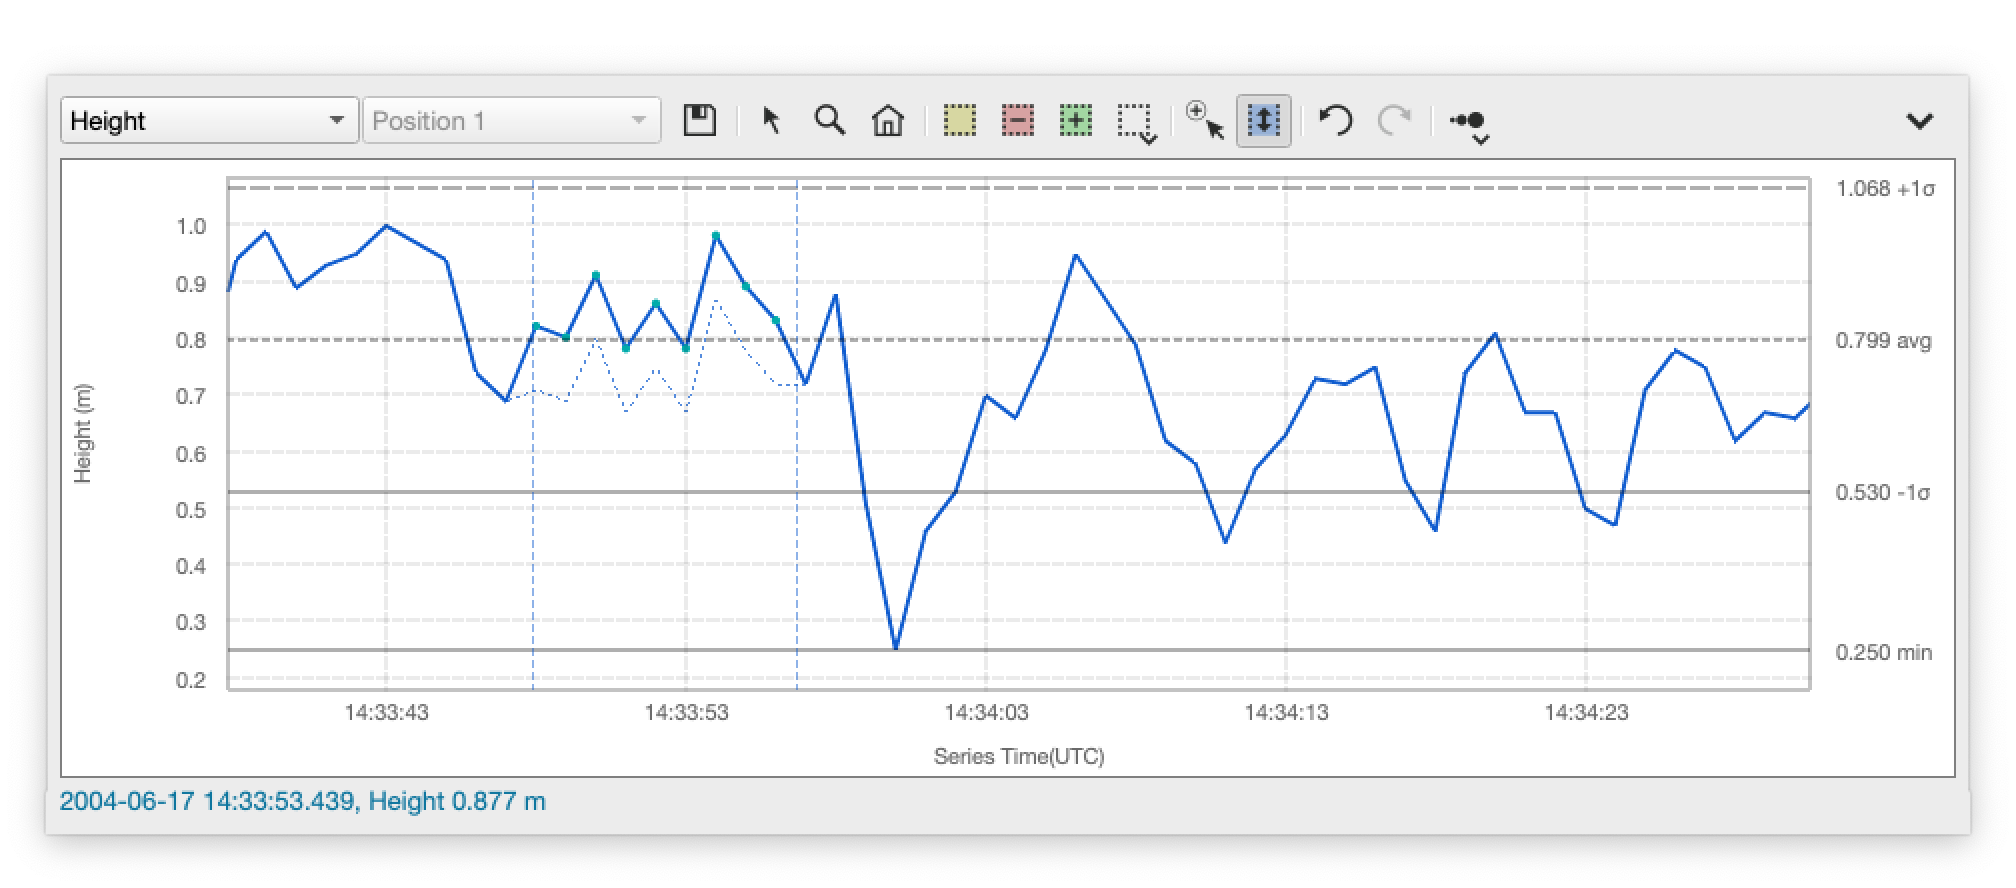
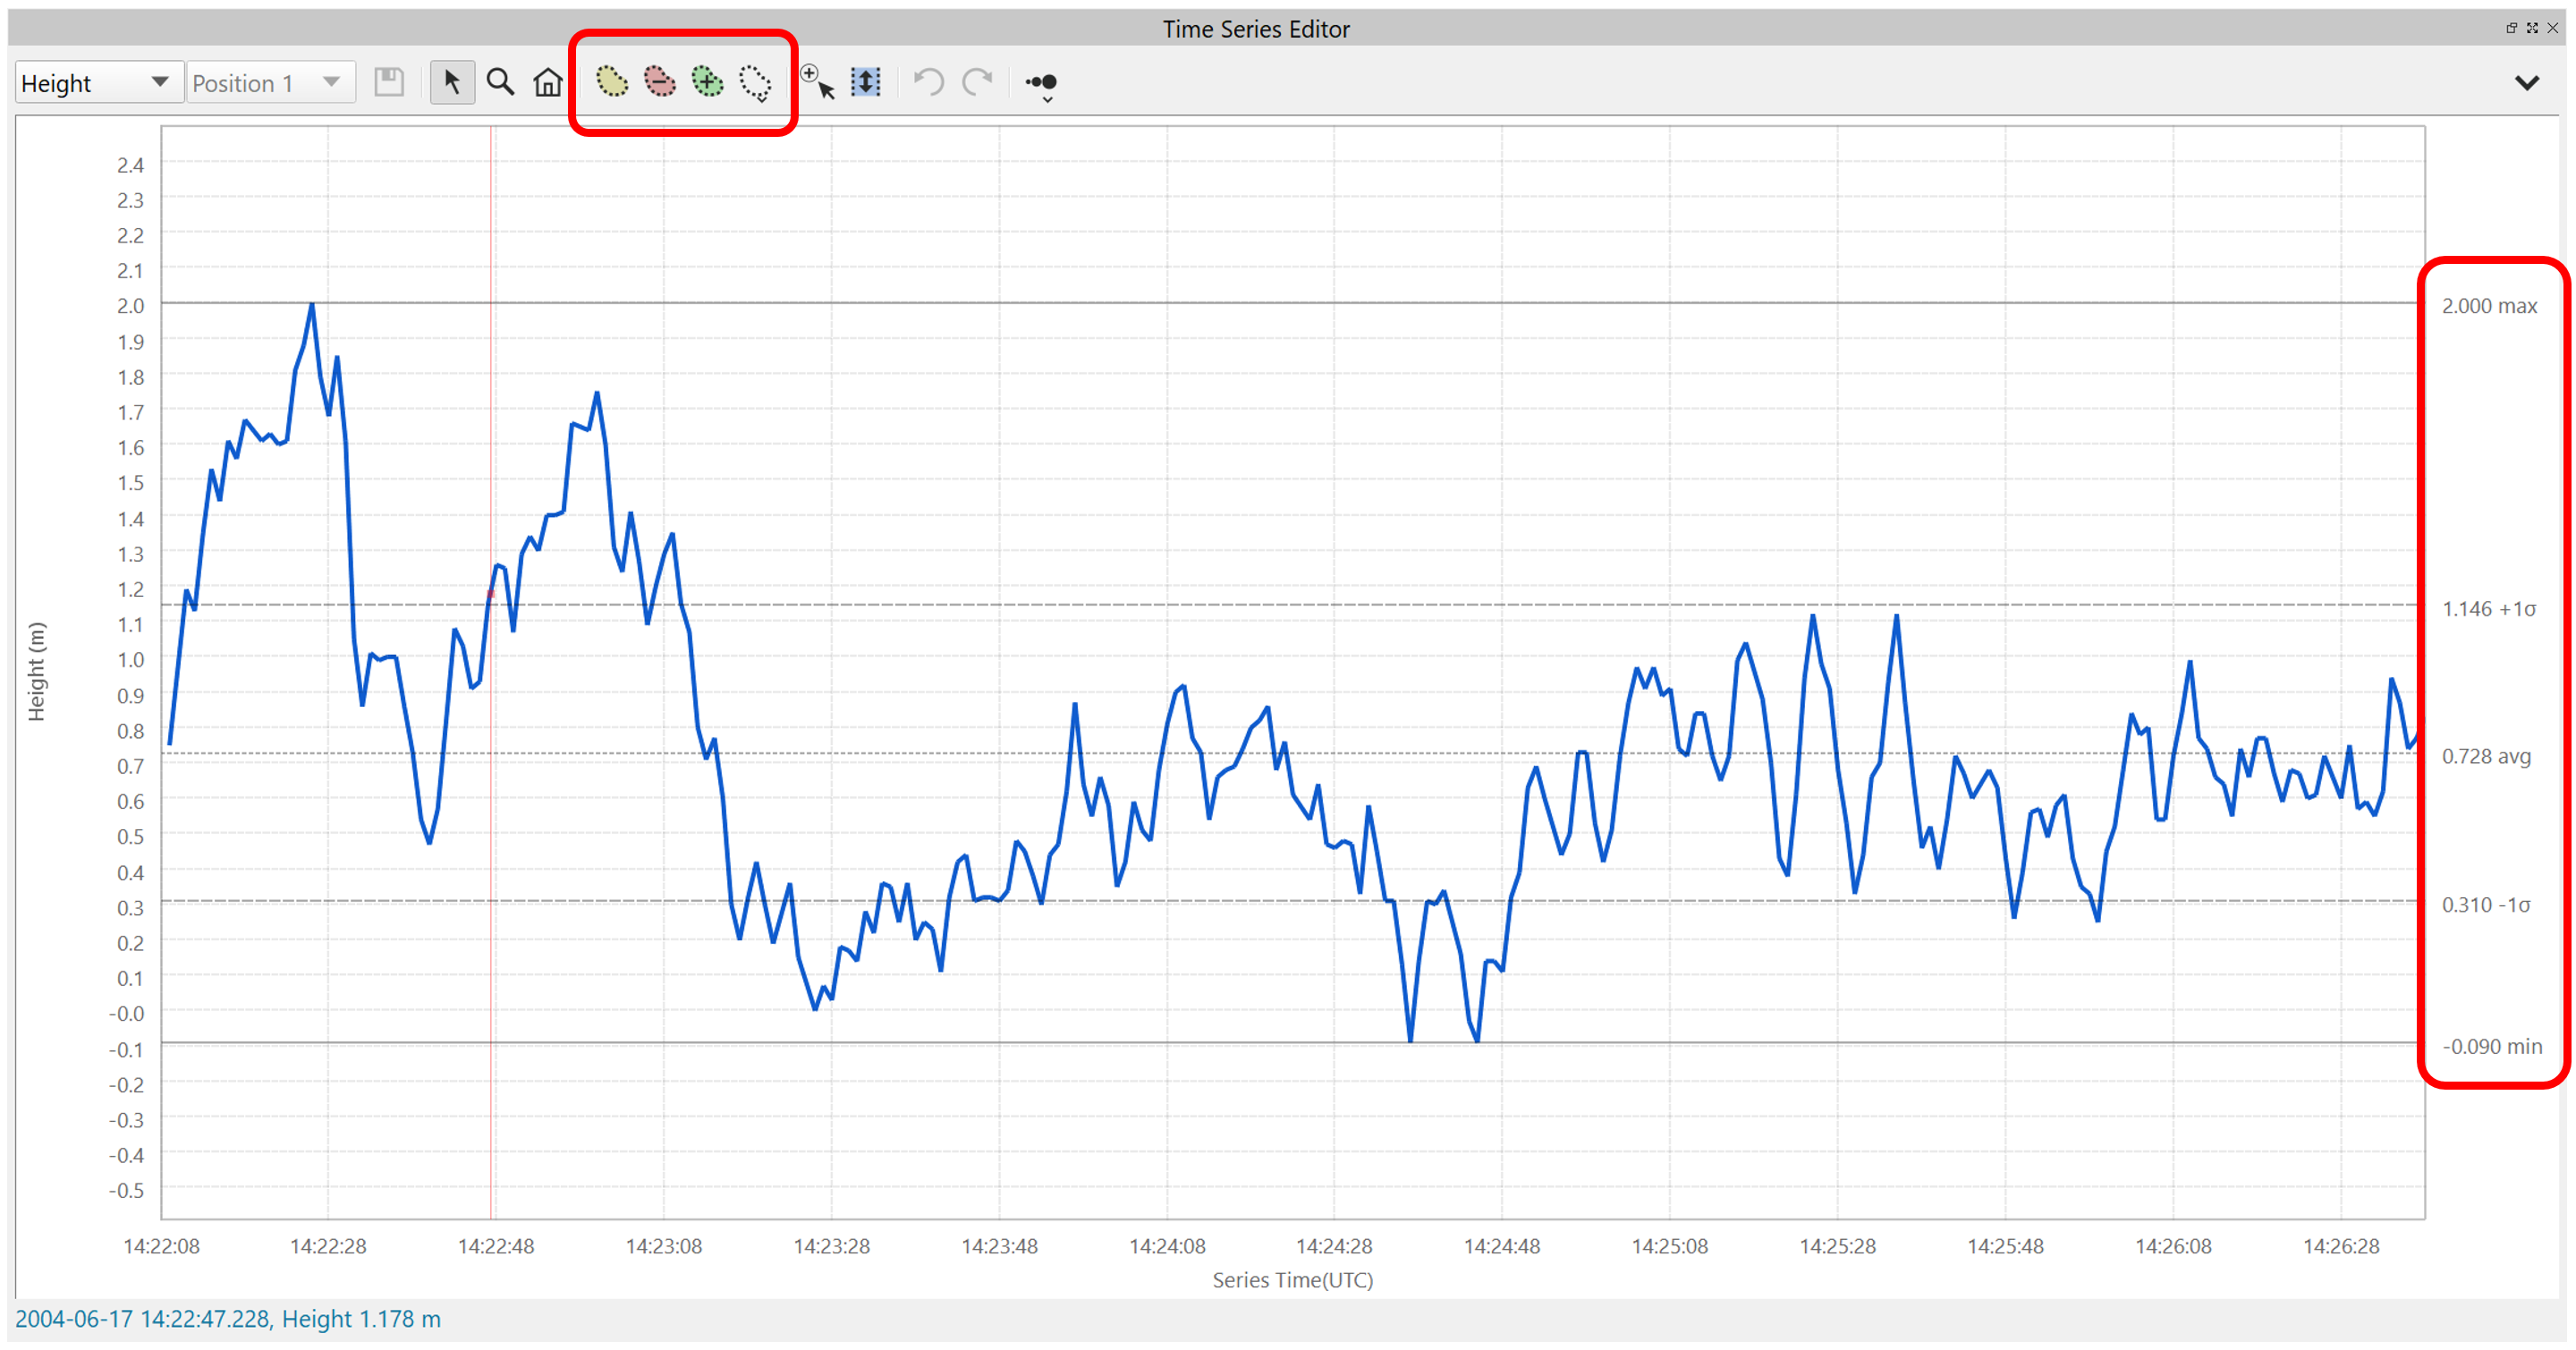
Two other improvements have been made in the time-series editor as well. Statistics about the time-series can be shown as a graphical overlay, with an option in the context menu to enable/disable the visibility of this overlay. The overlay will draw lines and will show labels for mean, minimum, maximum and also +/- 1 standard deviation. We've also copied the different manual edit tools from Slice Editor and you now have option for polygon or lasso edit, whereas before it was limited to just rectangular editing.
Re-classification Tools
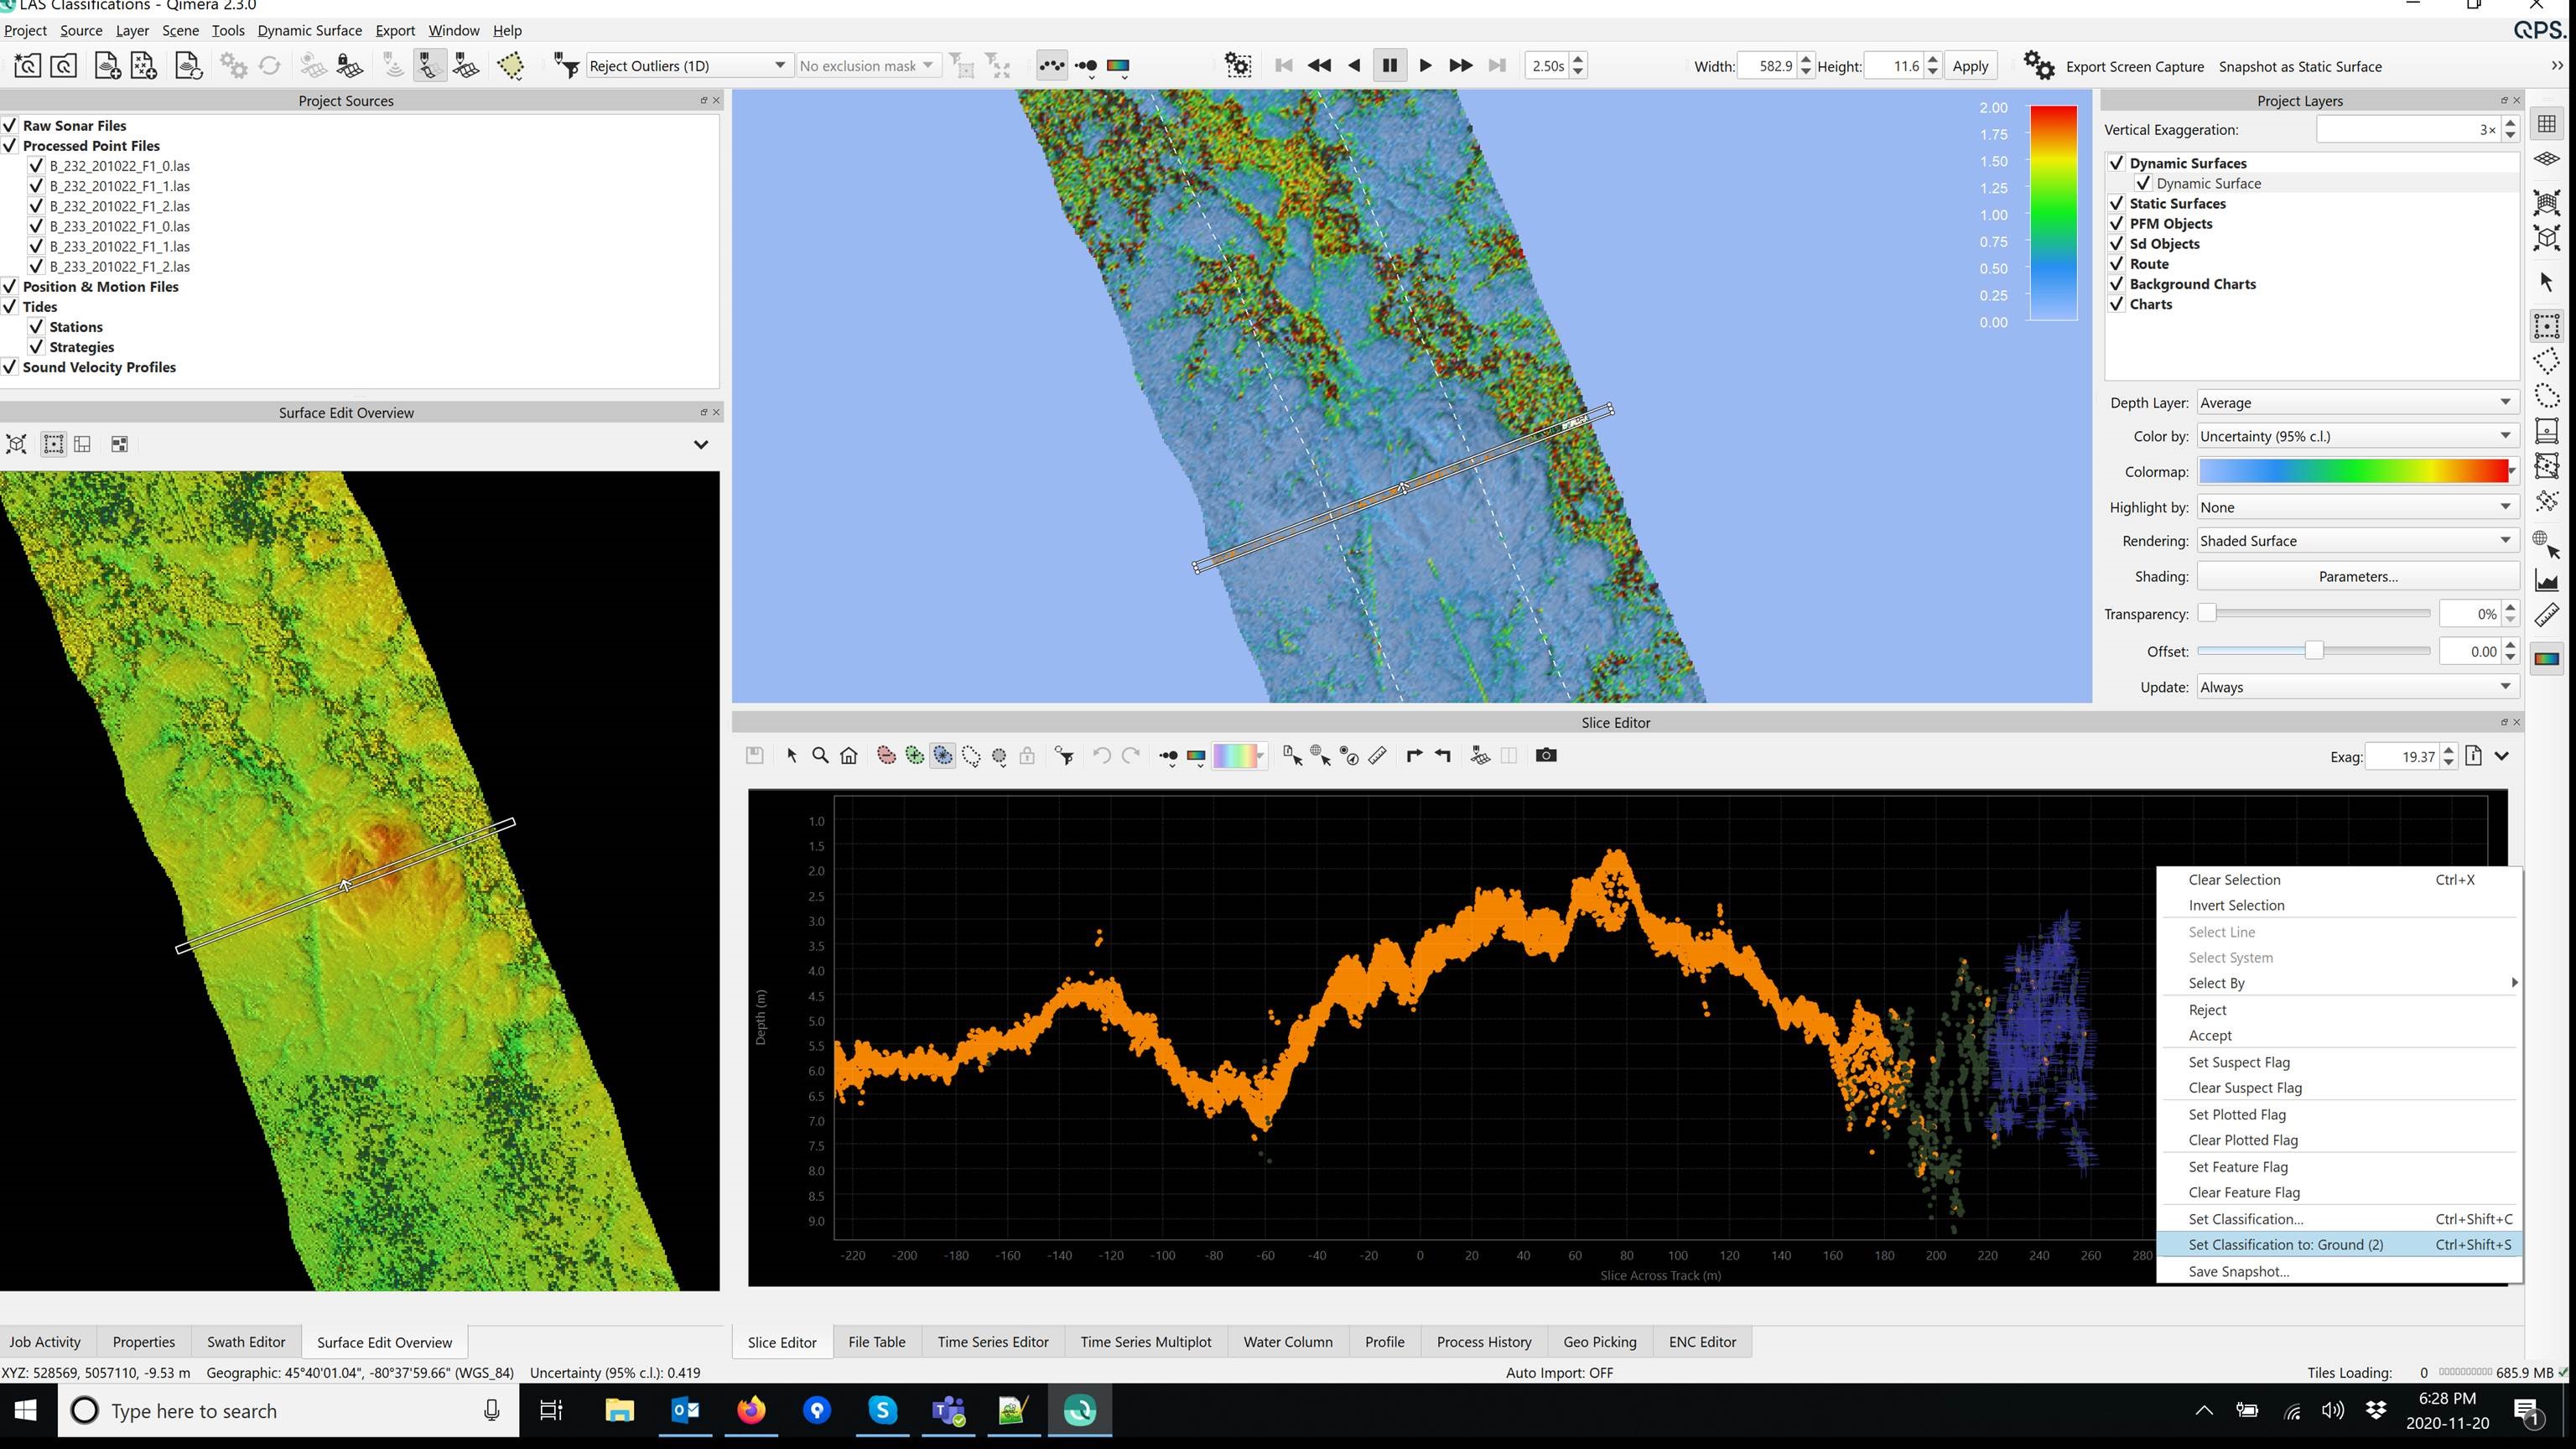
Following along with our toolset for bathymetric lidar point cloud processing, we have added the ability to select soundings in the Slice Editor and to change their classification. Previous releases allowed the use of the Filter toolbar to set classifications at the map level by drawing polygons on the Dynamic Surface. This new advance takes it one step further and allows for setting the classification of individual points in the Slice Editor. The new mode takes advantage of the existing "Select and Decide" editing mode in which you select points and then right-click to get a context menu from which you can choose actions like Accept, Reject, Set Plotted Flag, etc. New additions in this menu include the ability to set a new classification and also to set the classification to the last value that was used. The keyboard shortcuts for these also make it simple to set the classification once and then to quickly select more points and set their class with a keyboard shortcut. We have also upgraded the Slice Editor to show the standard American Society for Photogrammetry and Remote Sensing (ASPRS) classification codes. At the moment, this only works for LAS and LAZ file formats, but if you're interested to do this for other file formats, please get in touch with us: sales@qps.nl.
