Qimera 2.3.1 - Improvements
On this page:
Qinsy to Qimera Workflows
Auto-Import of QGF Files
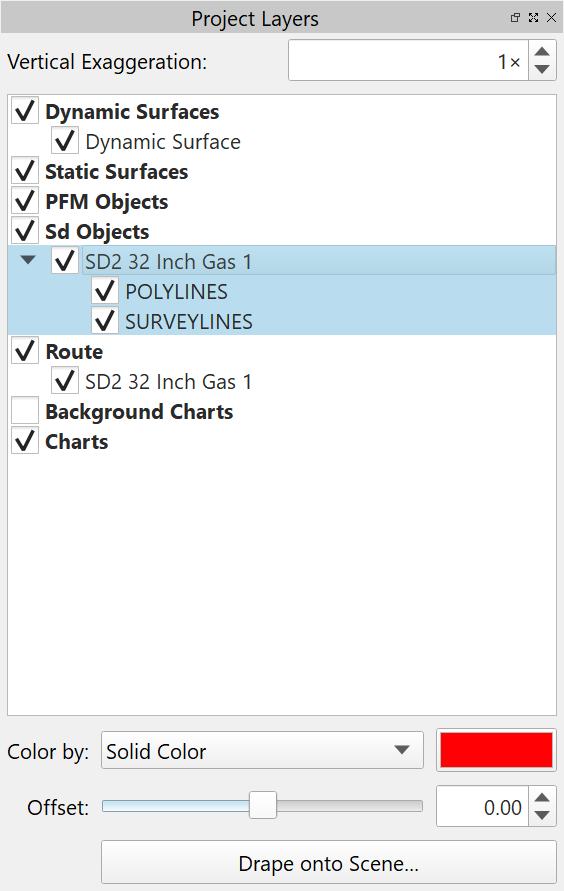
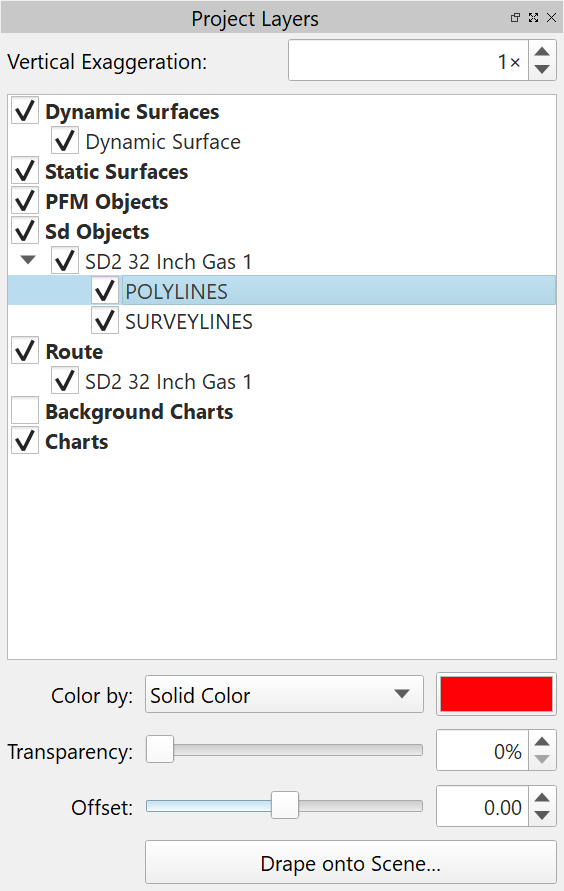
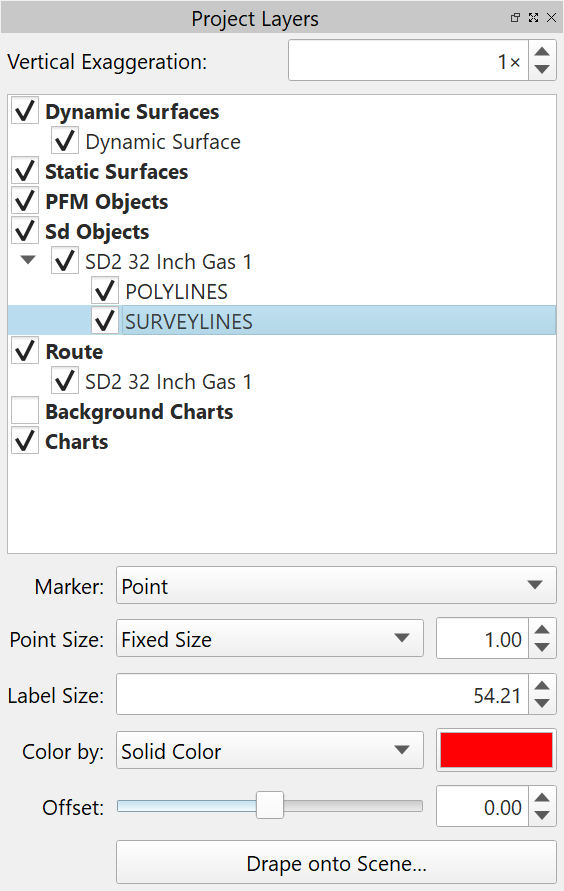
When opening a Qinsy project for the first time, any QGF files will be found and converted to .sd format and added to the Project Layers. Since .sd objects can only contain one object type per file (e.g. points in one file, lines in another), a QGF is "exploded" into a points and a lines .sd files. These are added under a single group with the group name coming from the QGF. Visibility can be controlled separately for points and lines as well using the normal mechanisms. Direct QGF support, i.e. support that does not require file conversion, will not come until the Fledermaus 8 Tempest visualization engine is integrated into Qimera but this provides a more streamlined experience in the meantime.
The image sequence below shows a QGF file that was automatically imported when the project was first opened. As you select separate elements, or the element top level grouping, you can change display options like coloring, etc, in the attributes panel immediately below. Note that you can still import other QGF files as well using the pre-existing method to import CAD data under the Layers menu.
KP Support for Qinsy users
Similar to the improved support for QGF files, there is now support for KP, or Kilometer Post, in Qimera. This is common in offshore work such as cable/pipeline work where it is necessary to be able to think in terms of linear distance along a cable/pipeline corridor. To access this functionality, Qimera will let you designate a QGF file as a "Route". Note that the QGF file may have been already imported into the project via the auto-import functionality described above, setting the Route is a separate action entirely since not all QGF users will have the need for KP, nor will all QGF files have KP embedded.
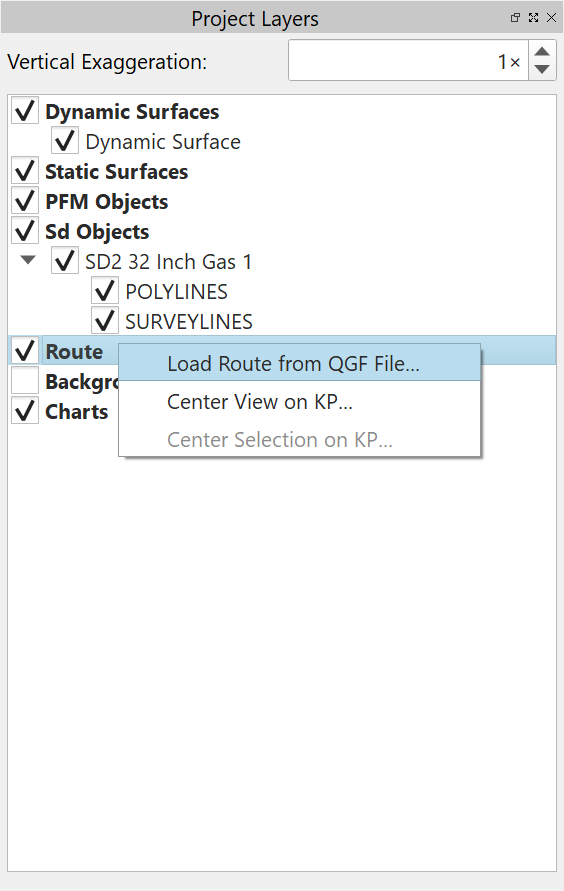
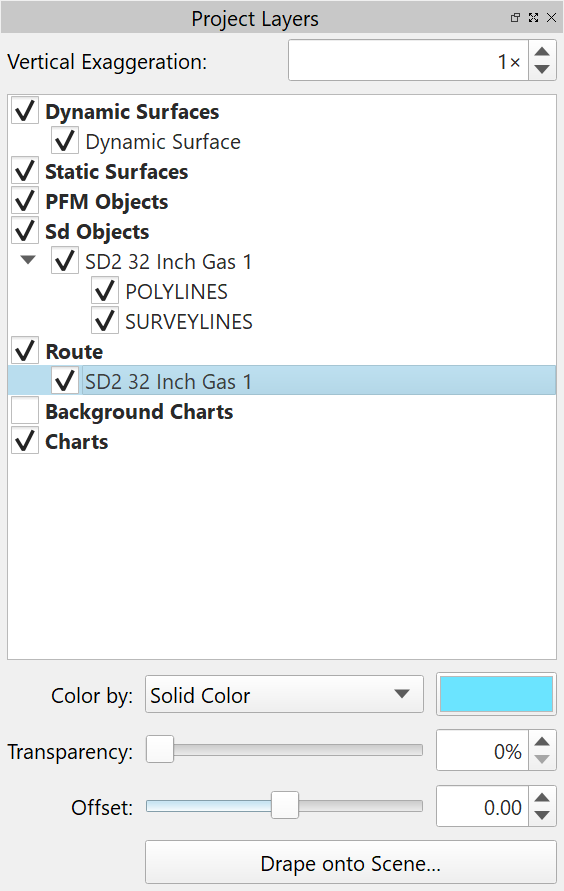
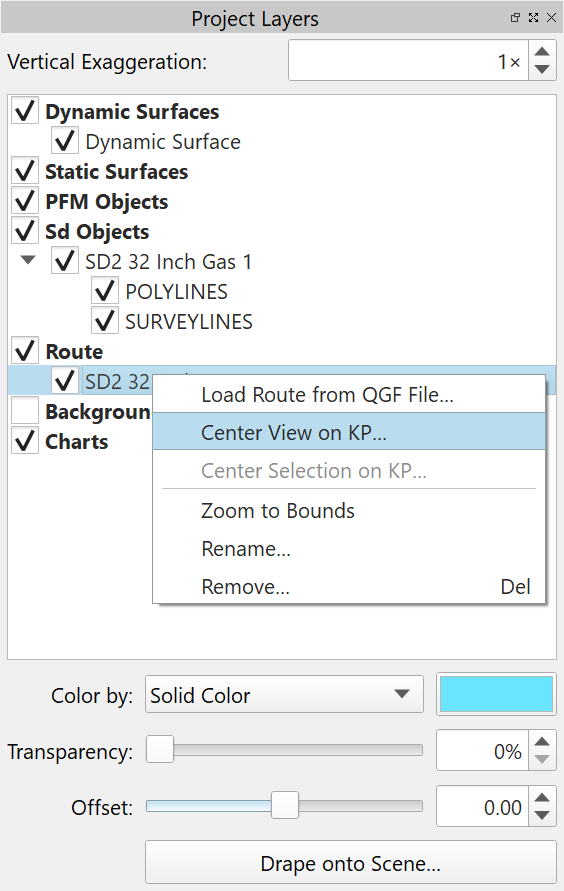
The image sequence below shows how a KP Route is loaded. There is a new "Route" node in the Project Layers tree, right-clicking this will allow you to specify a QGF file to use as a route. This can also be done from the Layers menu. Once it is loaded, it has the same display capabilities and options as the .sd objects described above.
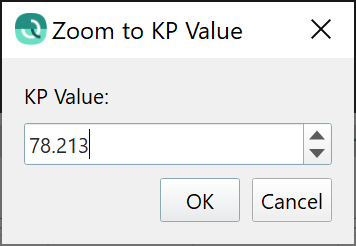
How is KP used? Another right-click on the active Route will let you center the view on a particular KP location. You can also add this as a custom button on the customizable toolbar and you can setup a custom keyboard shortcut as well, if this is a feature that you'd like to use often.
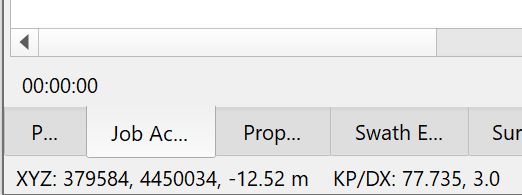
The KP for the mouse cursor position is displayed in the lower status bar of Qimera next to the coordinates, so it is quite simple to get a quick sense of the KP of a particular feature or location in the Scene.
While editing point cloud data in the Slice Editor, it is also possible to move any Slice boxes to a particular KP to examine data at the desired location. This is accessed under the Selection Movement menu in the Scene toolbar menu. You can also add a custom toolbar button for this and a keyboard shortcut.
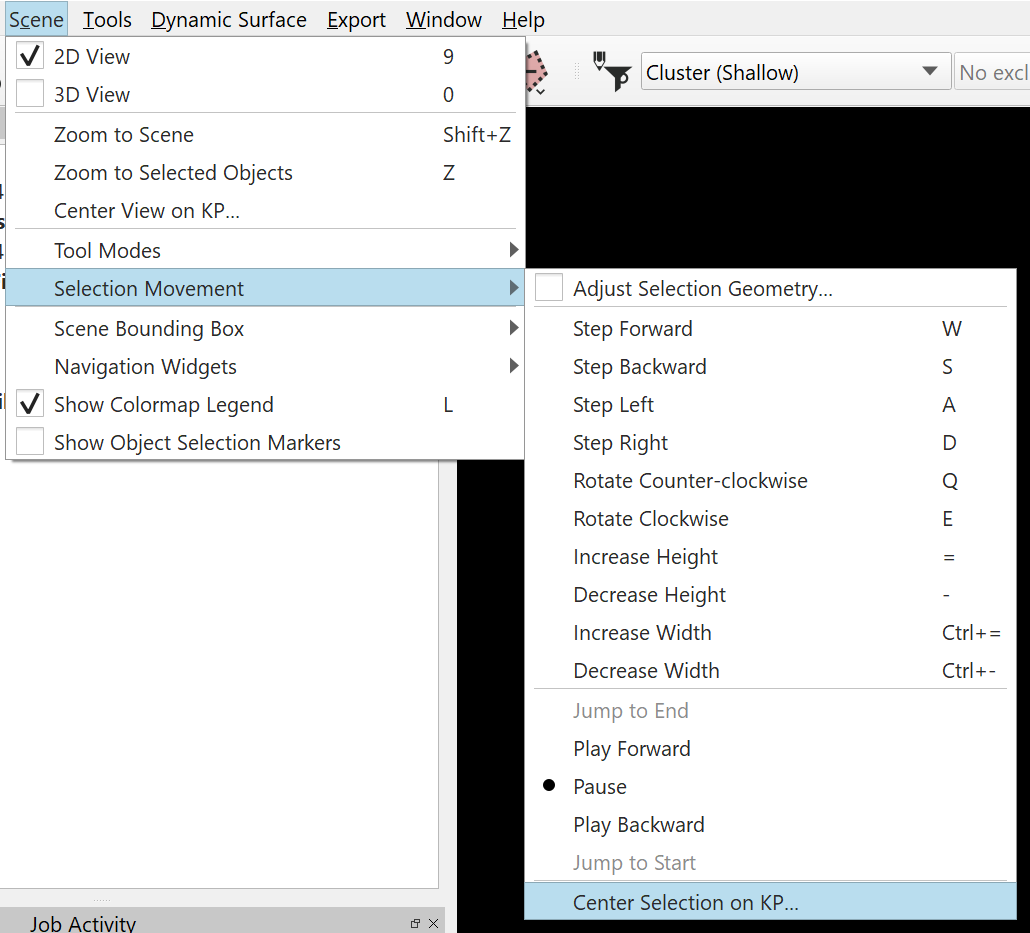
KP is also displayed in the following editors and docks:
- Swath Editor - Cursor read out and info panel
- Slice Editor - Cursor read out and info panel
- 3D Editor - Cursor read out
- Profile dock - Cursor read out
- GeoPick dock - GeoPicked positions now look up KP and add this as an additional attribute
- Time-Series Editor and Multiplot - Cursor read out
KP is supported in some exports as well:
- Exports of processed points now include the KP of the object position related to each footprint
- Time Series Editor and Multiplot include KP in their ASCII export
- Profile dock exports now include KP in the ASCII export of points along the profile
- The GeoPick table includes KP in ASCII export
Multi-object Configuration Improvements
With this release, we have made improvements to better support multi-object configurations, for example, a surface vessel with an ROV operating simultaneously. The major improvement is that the QPD object track is extracted for both objects, allowing for full raw sensor processing for both objects. Previous versions of Qimera did not support object track extraction in the event that both objects were simultaneously collecting multibeam data, nor was it systematically done in instances where only one object was collecting multibeam data.
During import from these configurations, the db is examined as usual and split into multiple objects as was done previously. The major improvement in this release are:
- The QPDs from online calculations are copied into object subdirectories and then stripped of data from the objects not associated with the subdirectory, leaving a smaller version of the QPD in each object subdirectory. Backup QPDs are made during this process, as usual, prior to copying and removal of objects.
- QPD object tracks are more systematically extracted from the QPD.
- QPD object tracks are more systematically set as the primary source of navigation and height and the vertical referencing strategy is more systematically set to RTK (previously known as "Accurate").
- For multi-object setups with subsea vehicles such ROV/AUV, Qimera will now also extract any pressure or depth sensor time-series for depth calculation for the ray trace start point along with the QPD object track for vertical georeferencing when the object type is configured as ROV or AUV.
- In these kinds of multi-object situations, not all objects are collecting multibeam data at the same time. In this scenario, objects without MBE, laser or SBE data can now be stopped from importing so as not to clutter the post-processing experience in Qimera with objects that have no data associated with them for processing. This can be controlled by a new user preference, the default setting is disabled. This works by examining the QPDs after import and removing any that have no valid data in them, this works for all raw sonar and processed point file formats, though it is most applicable to Qinsy.
Multi-Polygon and Multi-Line Objects
In this release, you can now create multi-polygon or multi-line objects using the normal spatial selection tools like lasso and polygon. This is handy for creating a set of polygon areas in which you may want to prevent any automated filtering from happening when using the Filter Toolbar. You can also use these types of Exclusion Masks in the vertical shifting tools as a way to constrain the vertical shifting analysis away from selected areas. You can also make line objects in a similar manner with the profile tool, this is useful for quickly creating a set of infill lines to pass to the online surveyor. The resulting polygon or lines file can be exported as DXF, for example, for this purpose. A multi-polygon DXF can also be imported (and converted to .sd format) and then used as an Exclusion Mask as well.
Making Multi-Polygon Objects
The image sequence below shows an example of how to create a multi-polygon Exclusion Mask.
You can draw in the Scene with various selection modes, then save these as a .sd object with right-click, this has been in Qimera for quite a while now but this first step is crucial to getting started.
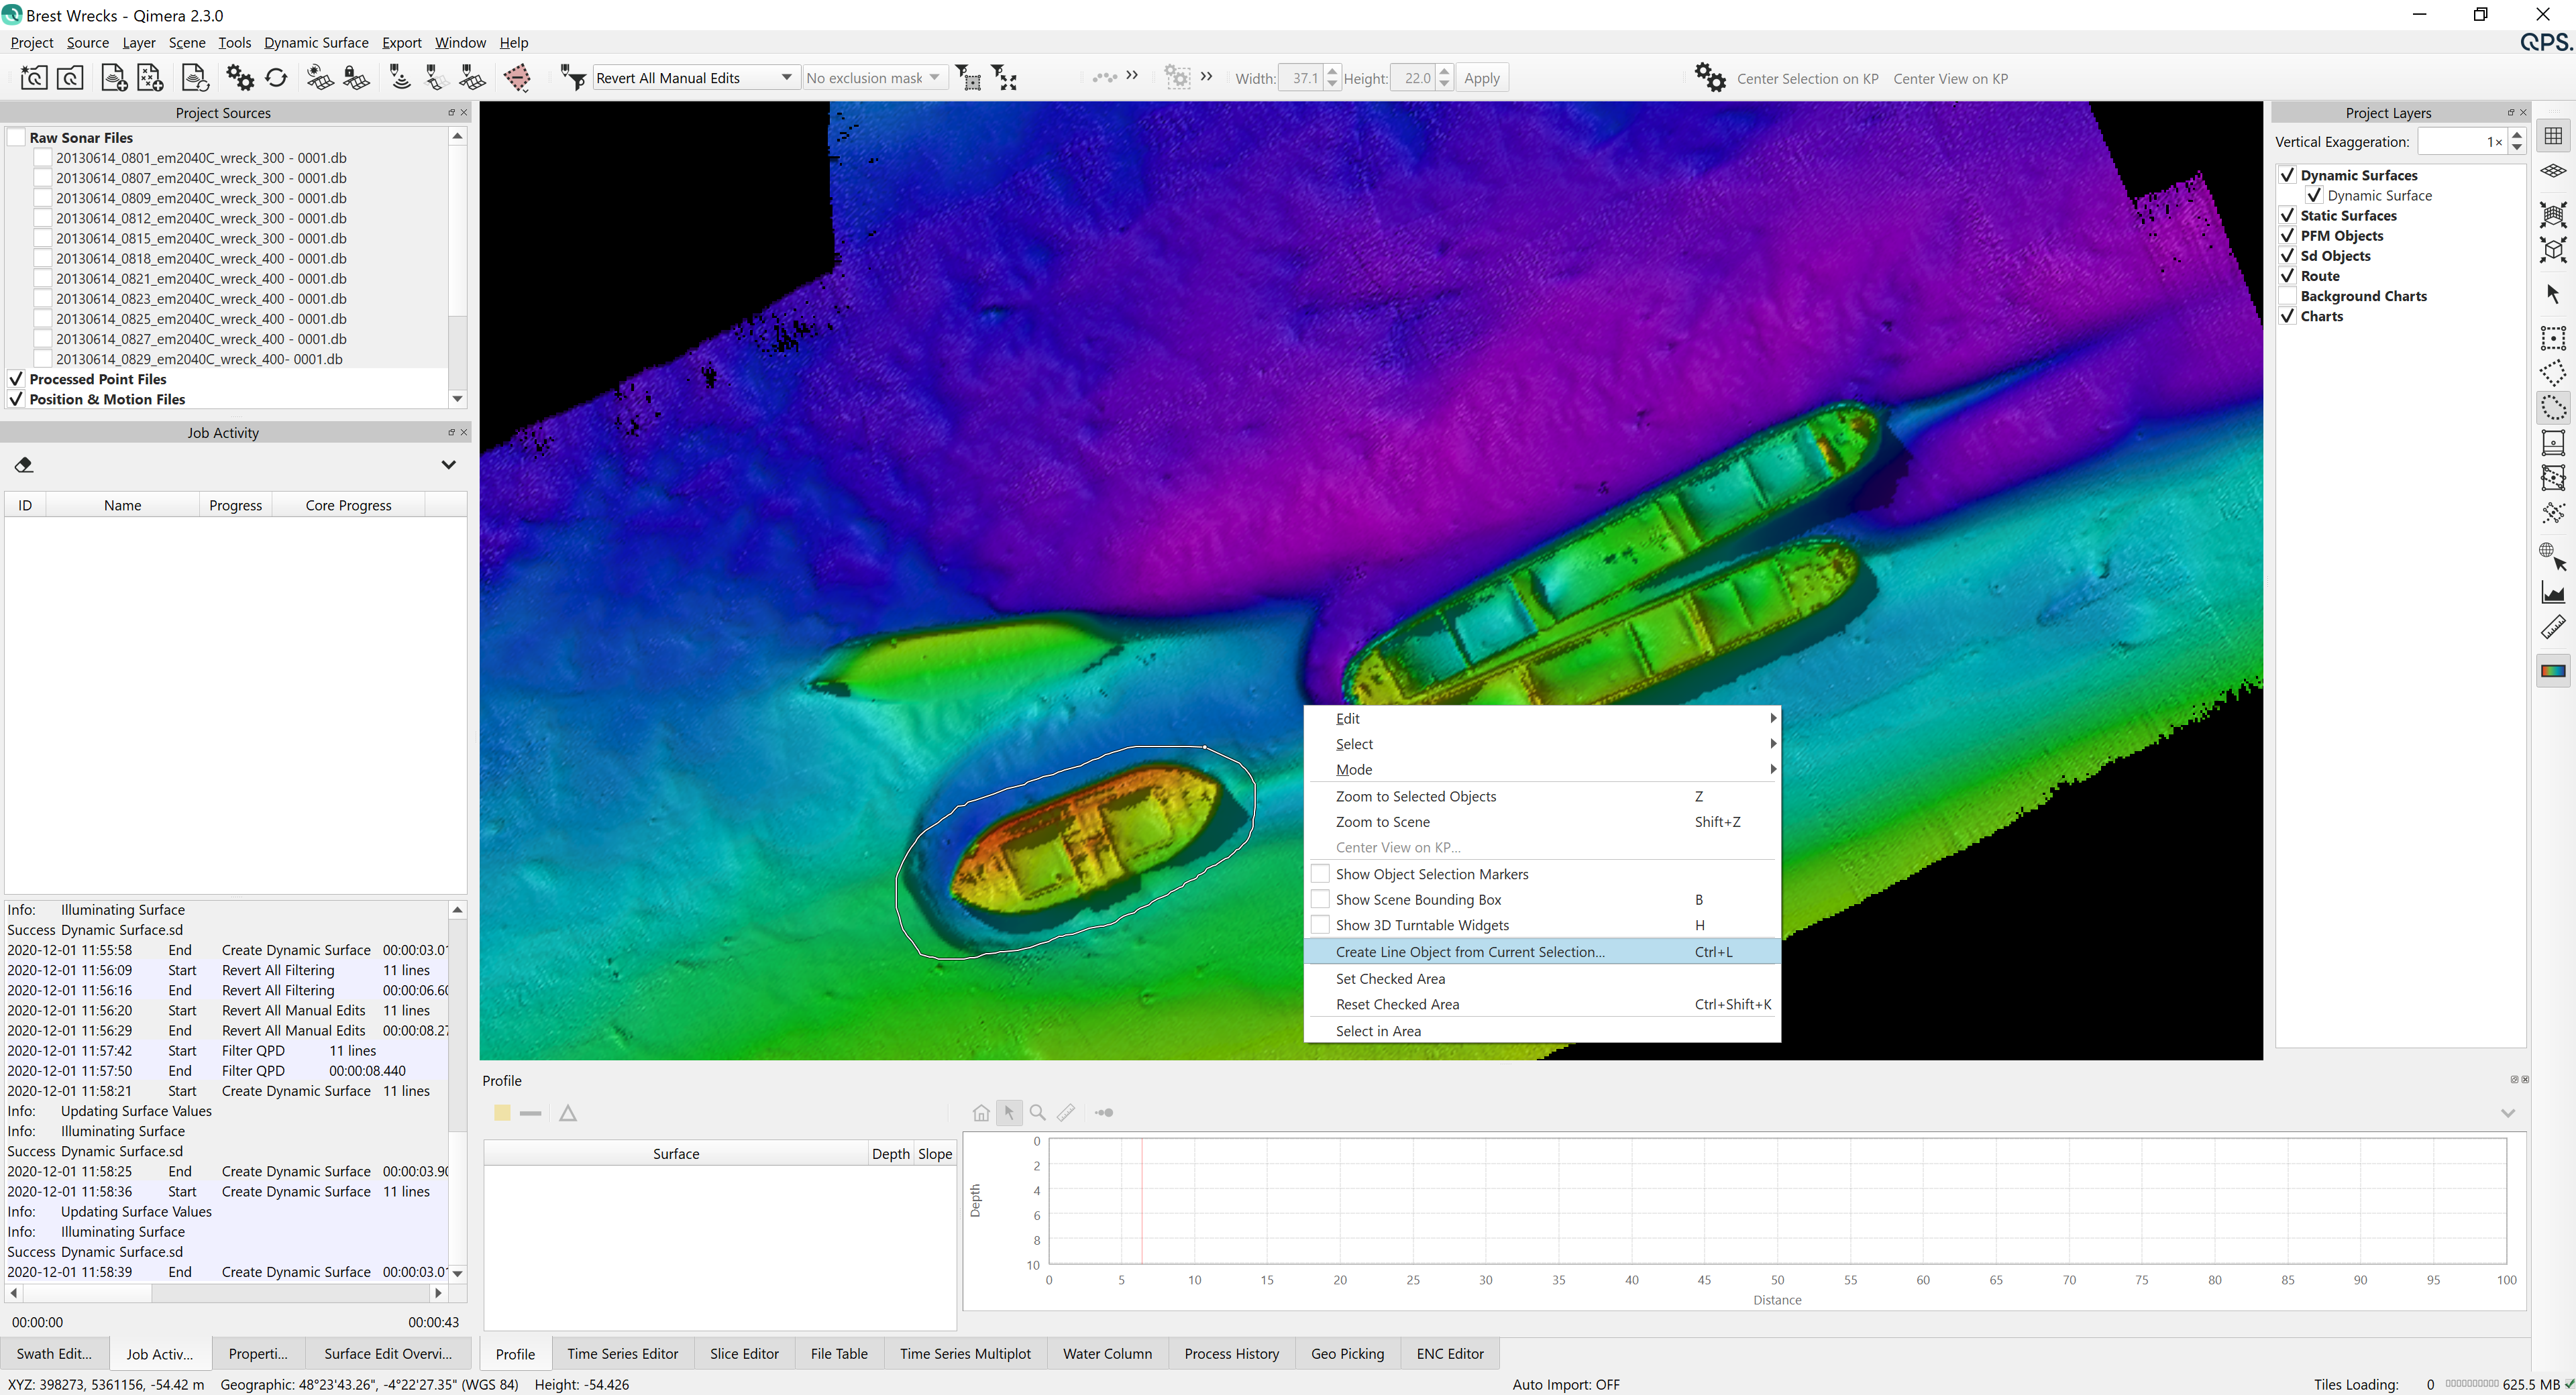
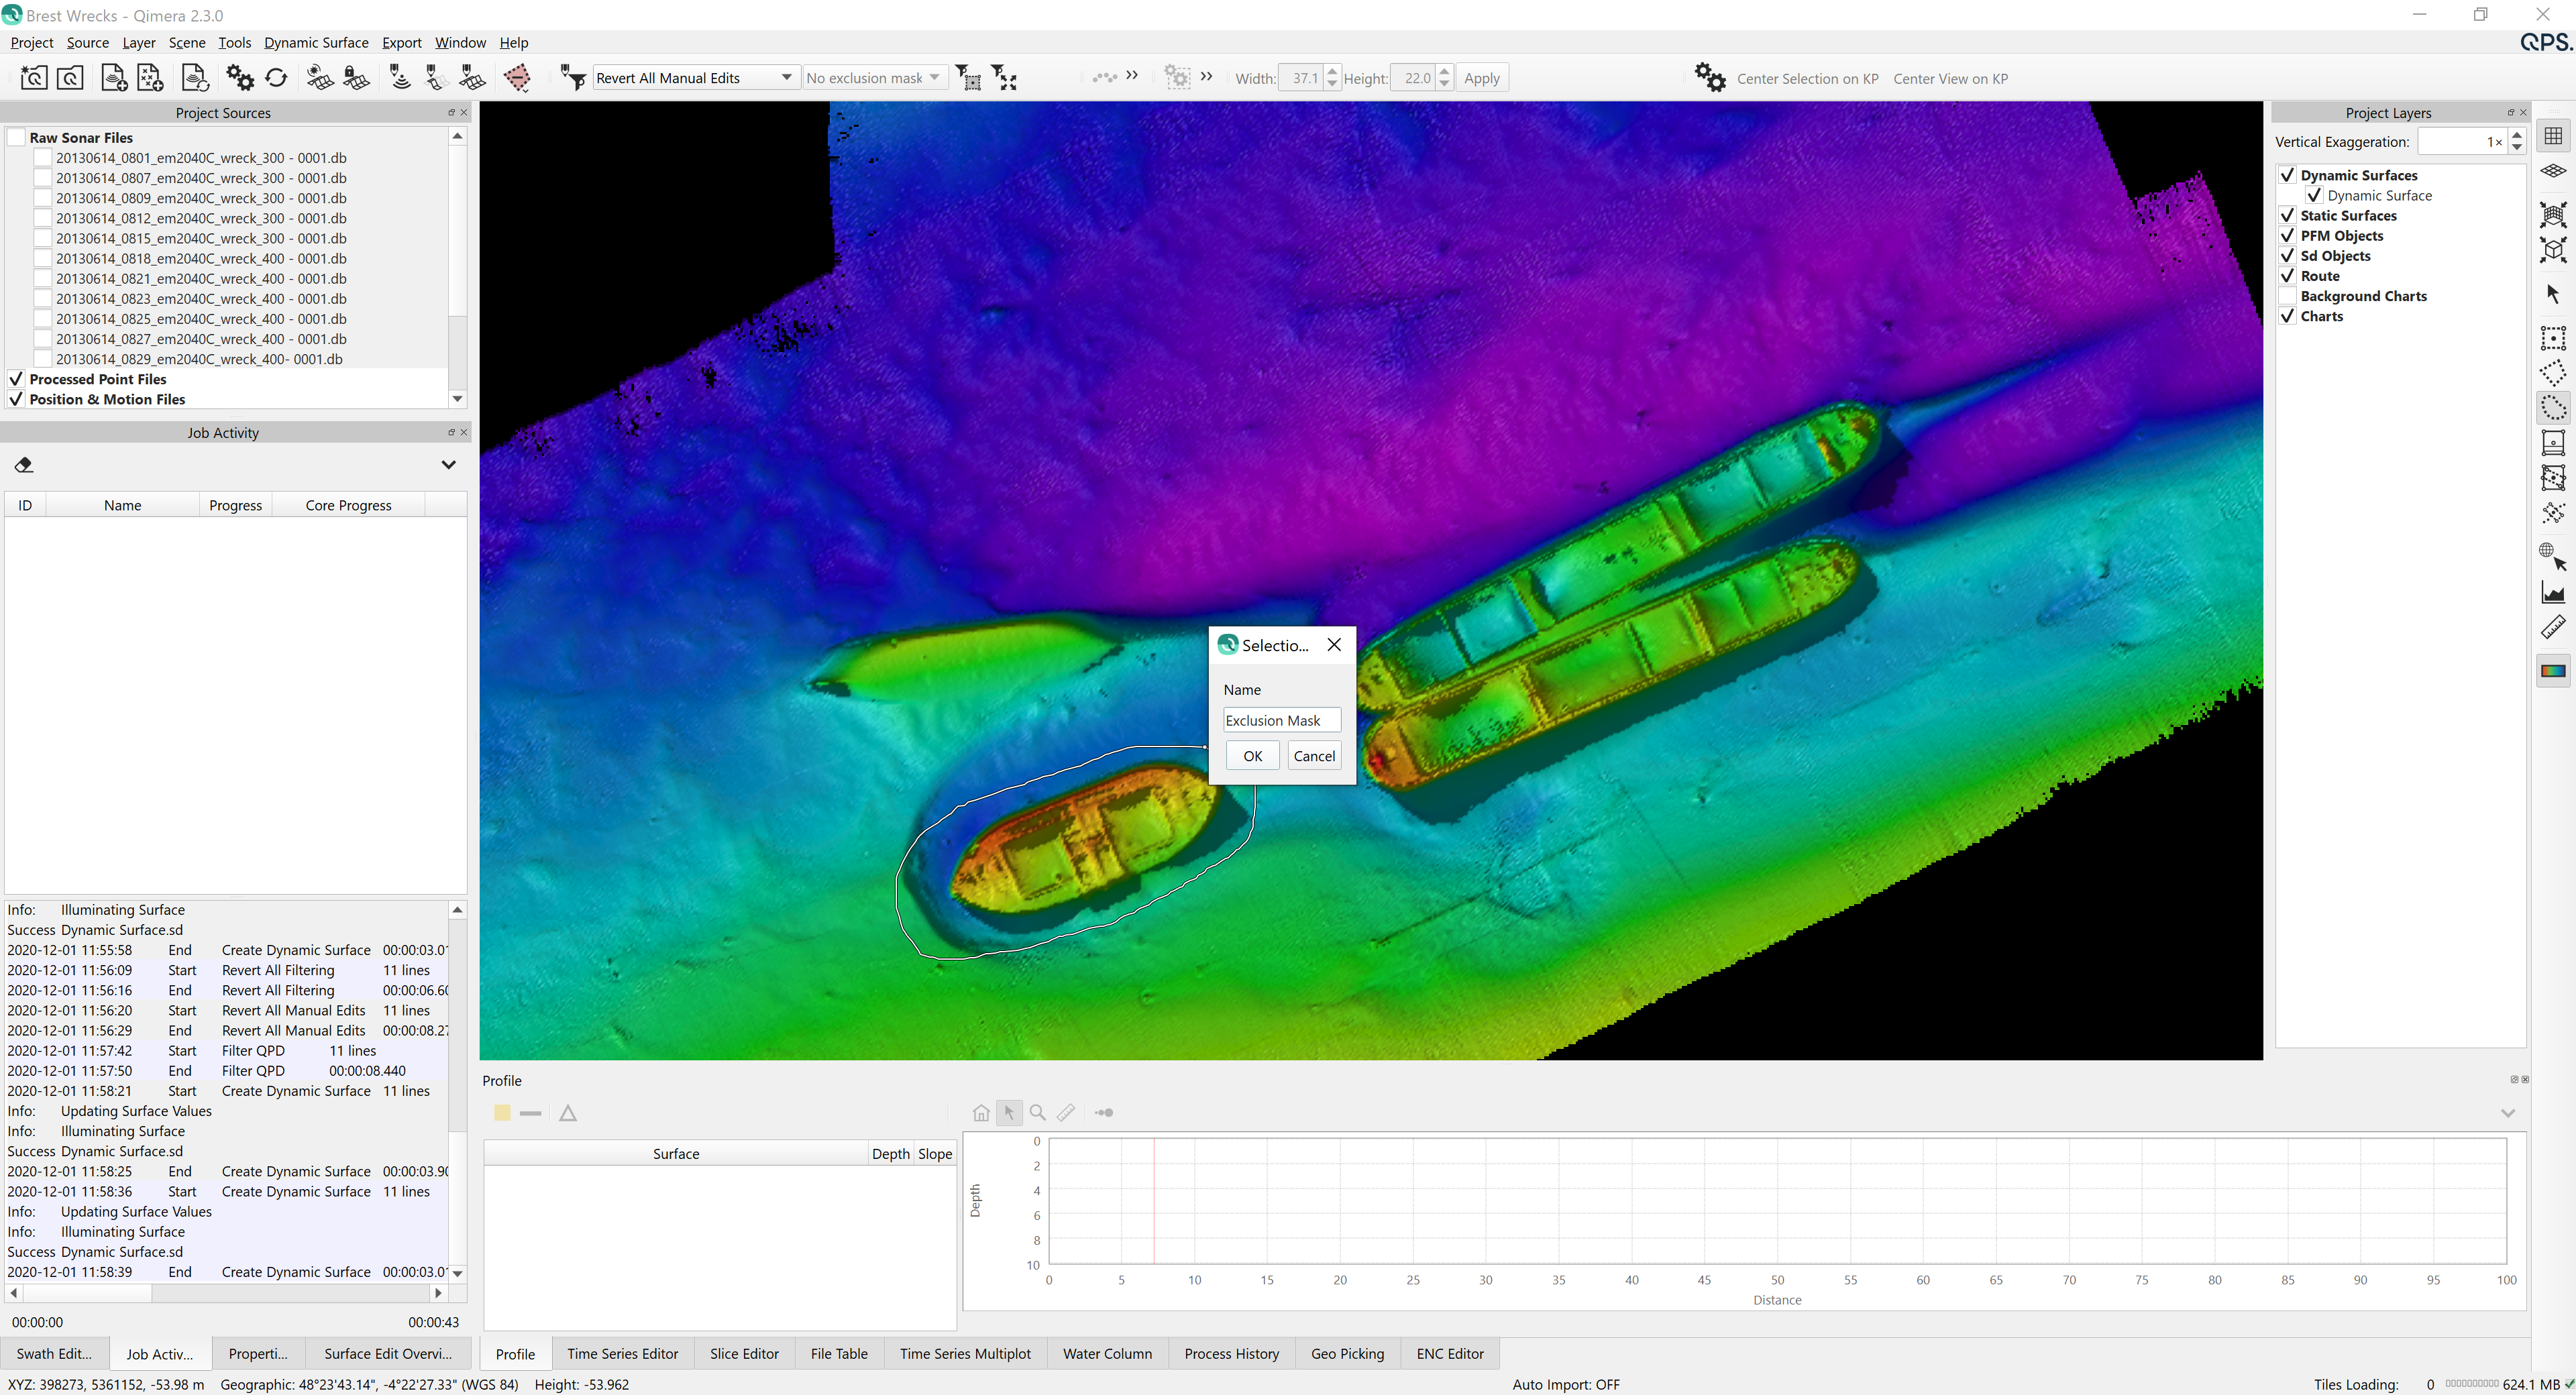
When you select the line creation option, you'll be prompted for a file name, a .sd polygon object will be saved in your project and will appear in the Project Layers.
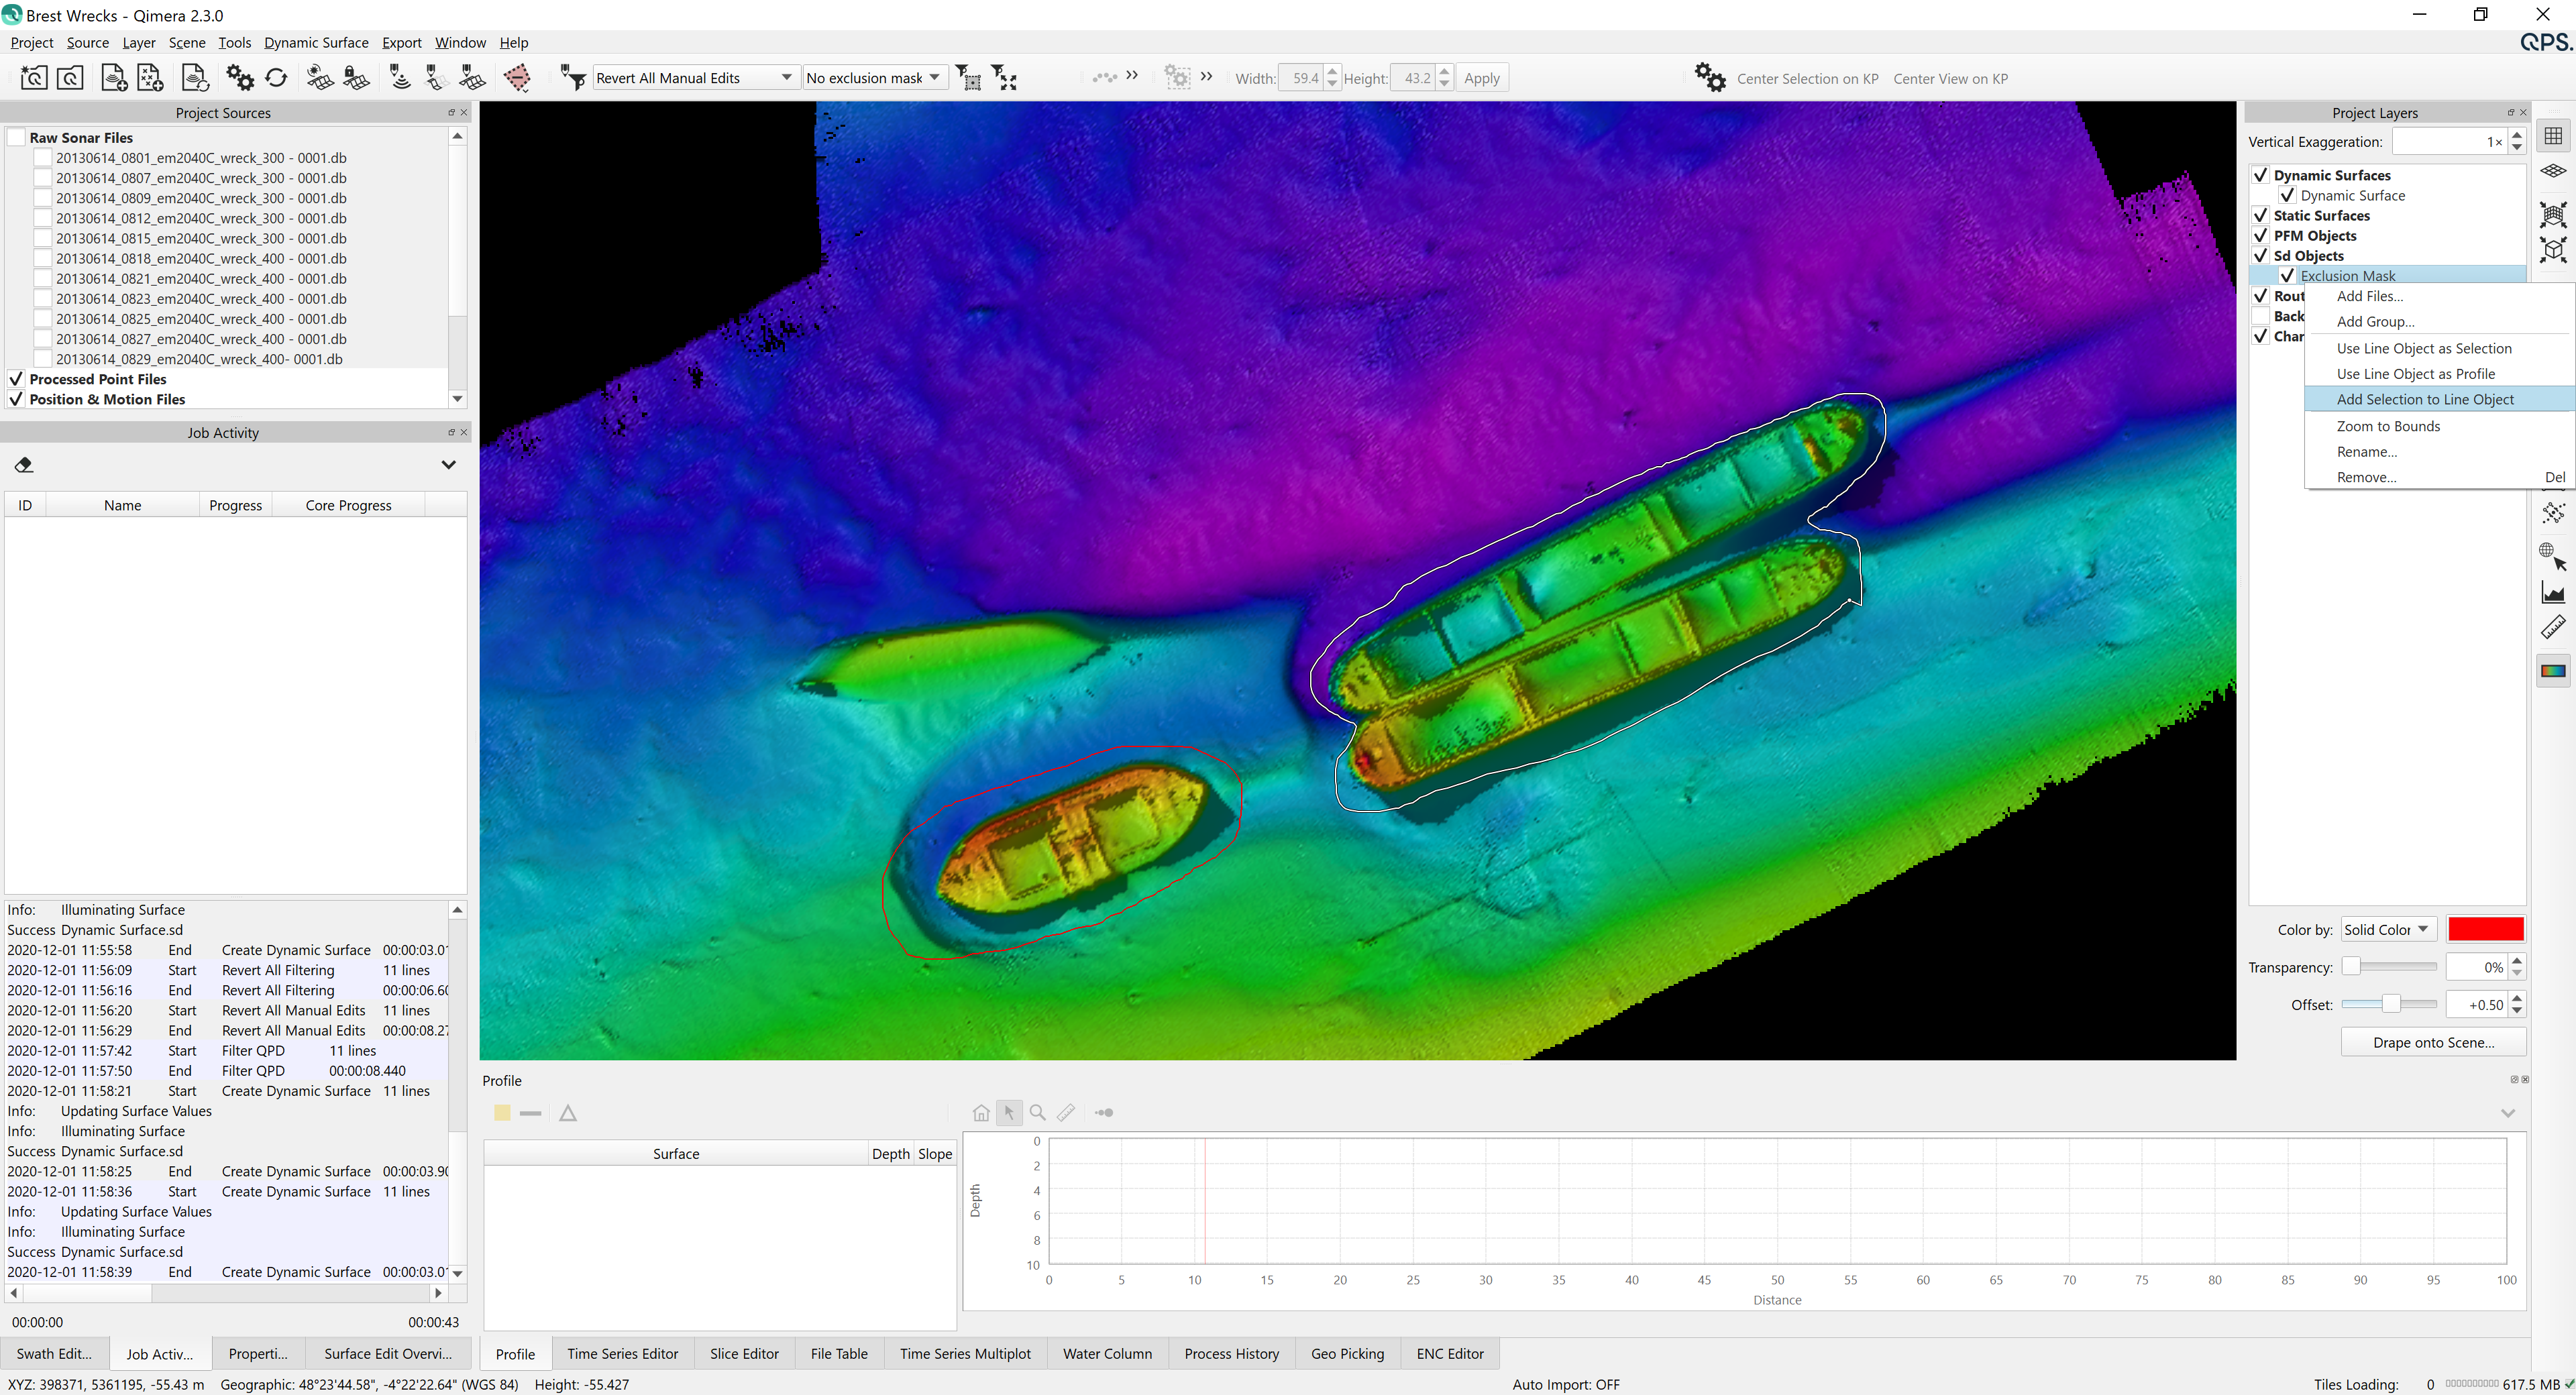
Once you have a .sd object, you can add more polygons to it by drawing new polygons or lines and then right-clicking on the existing .sd object and choosing "Add Selection to Line Object". You can use this to collect a set of areas or lines in a single .sd object, as shown below where polygons are drawn around multiple wrecks in the same area.
Finally, the last wreck's polygon is added to the .sd file.
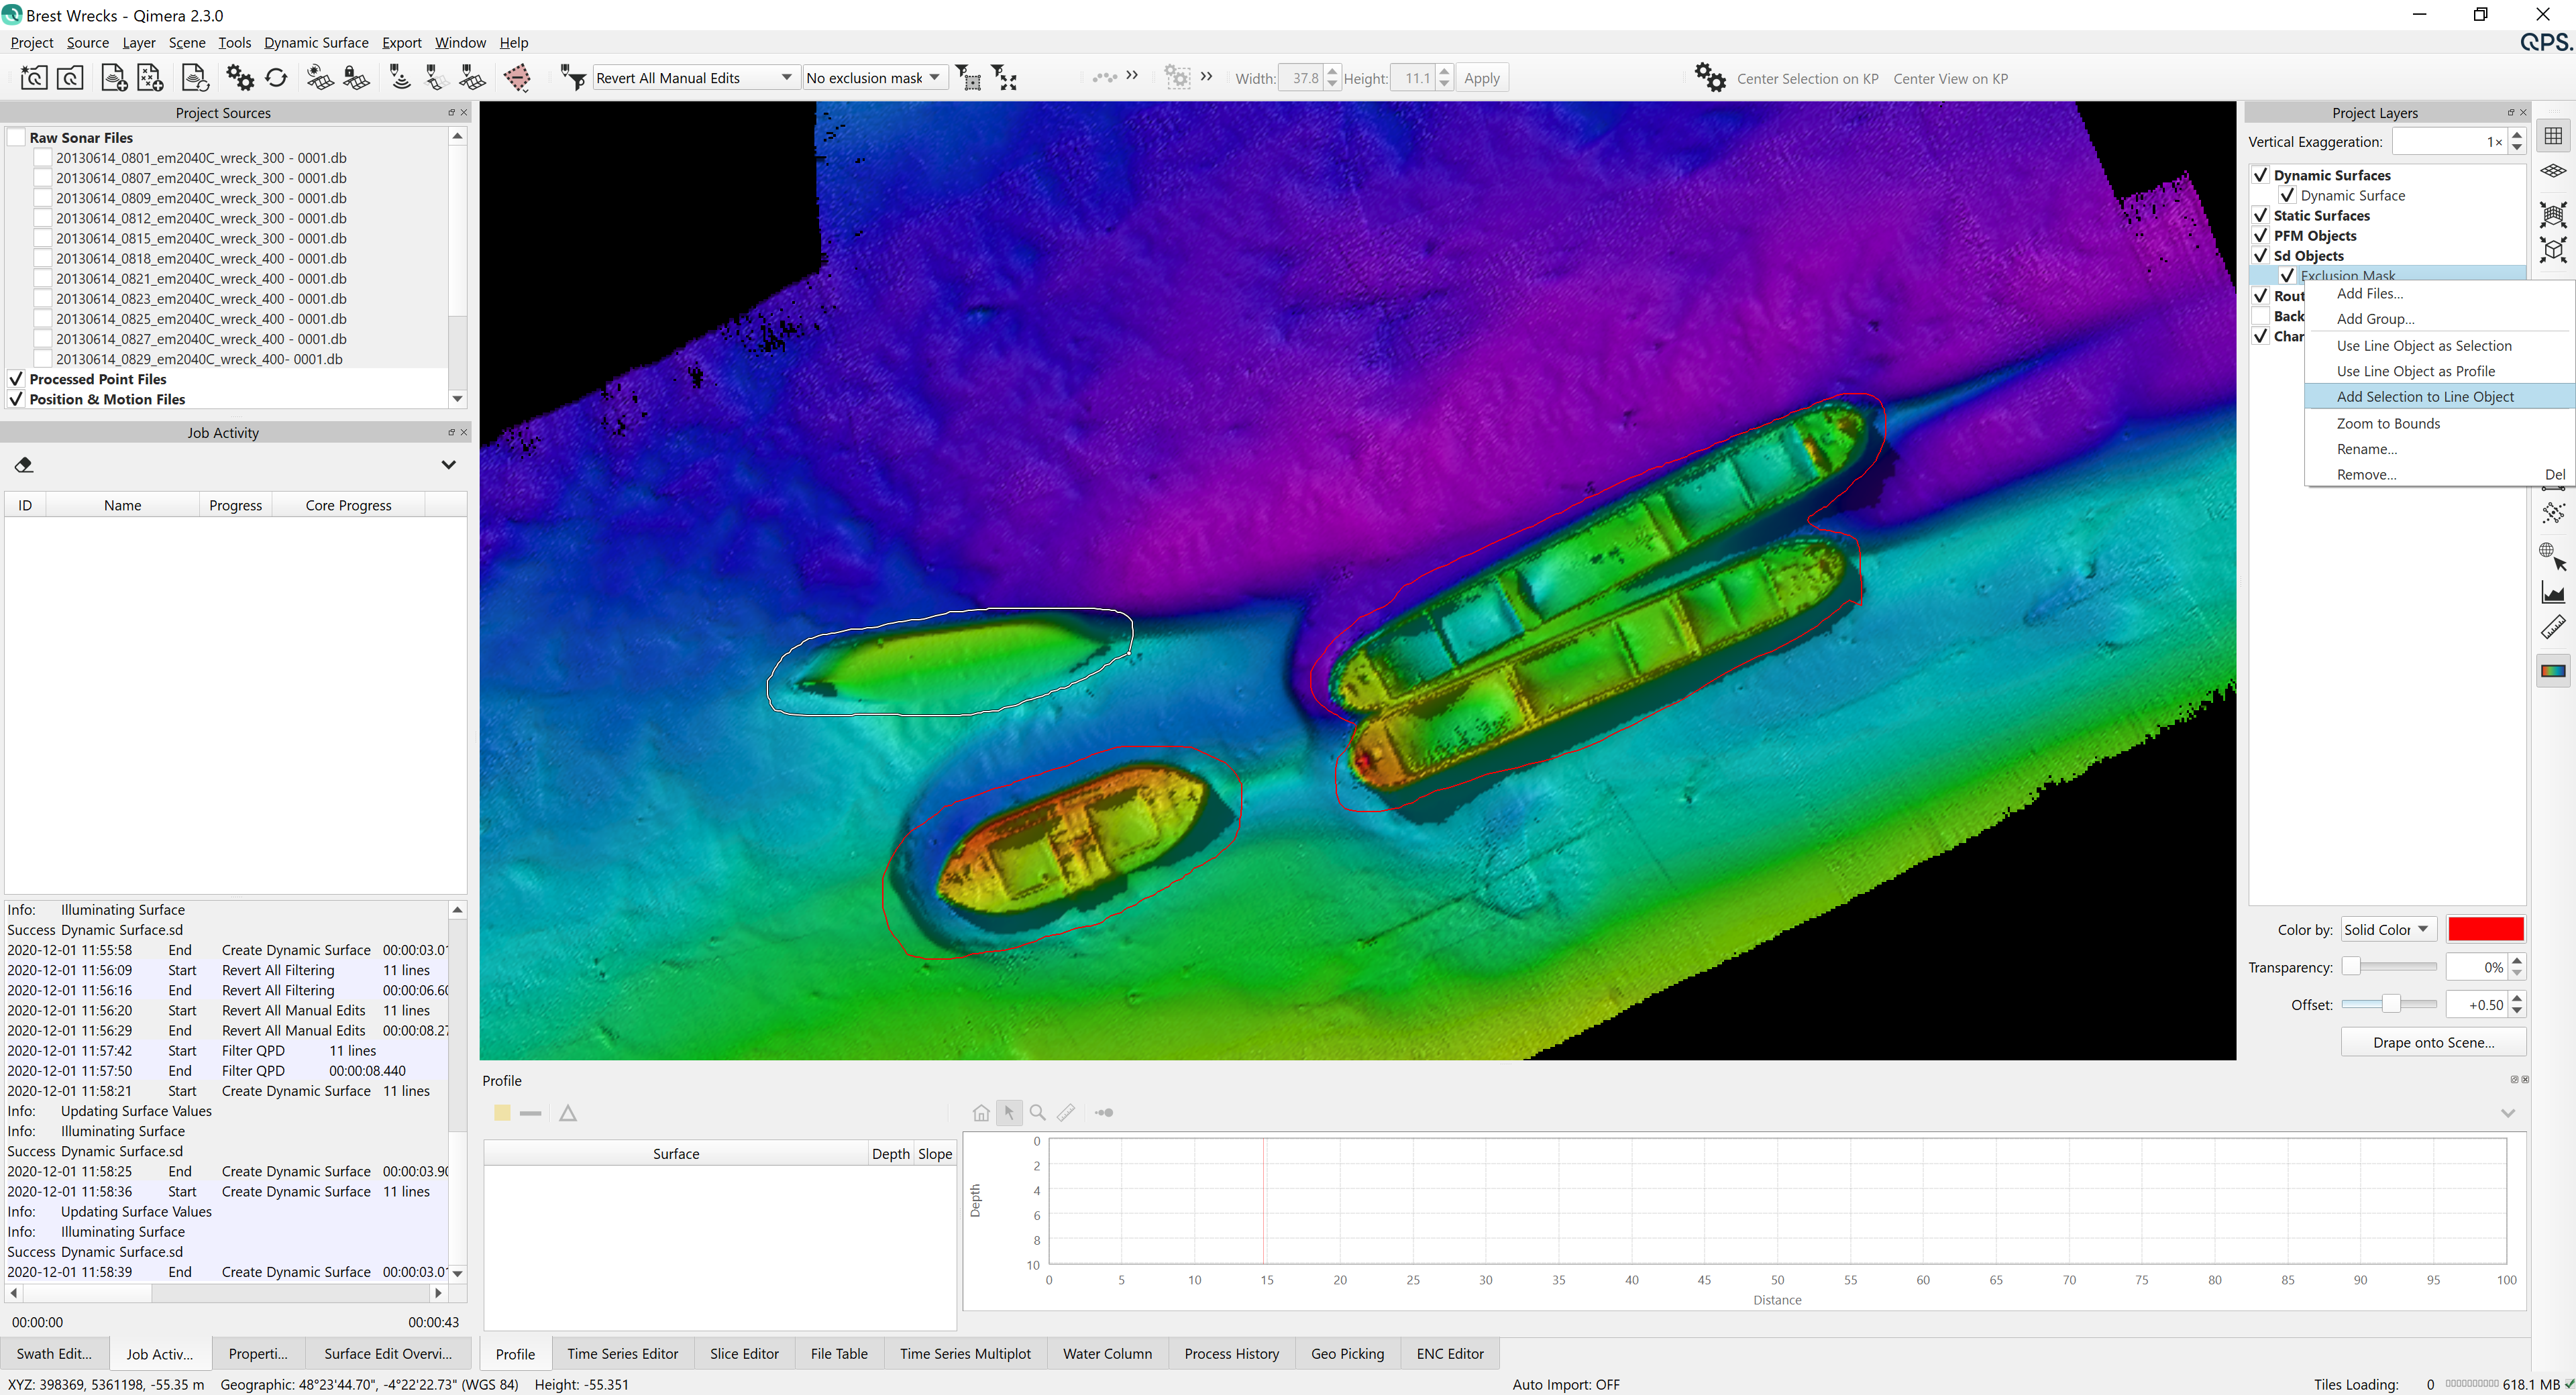
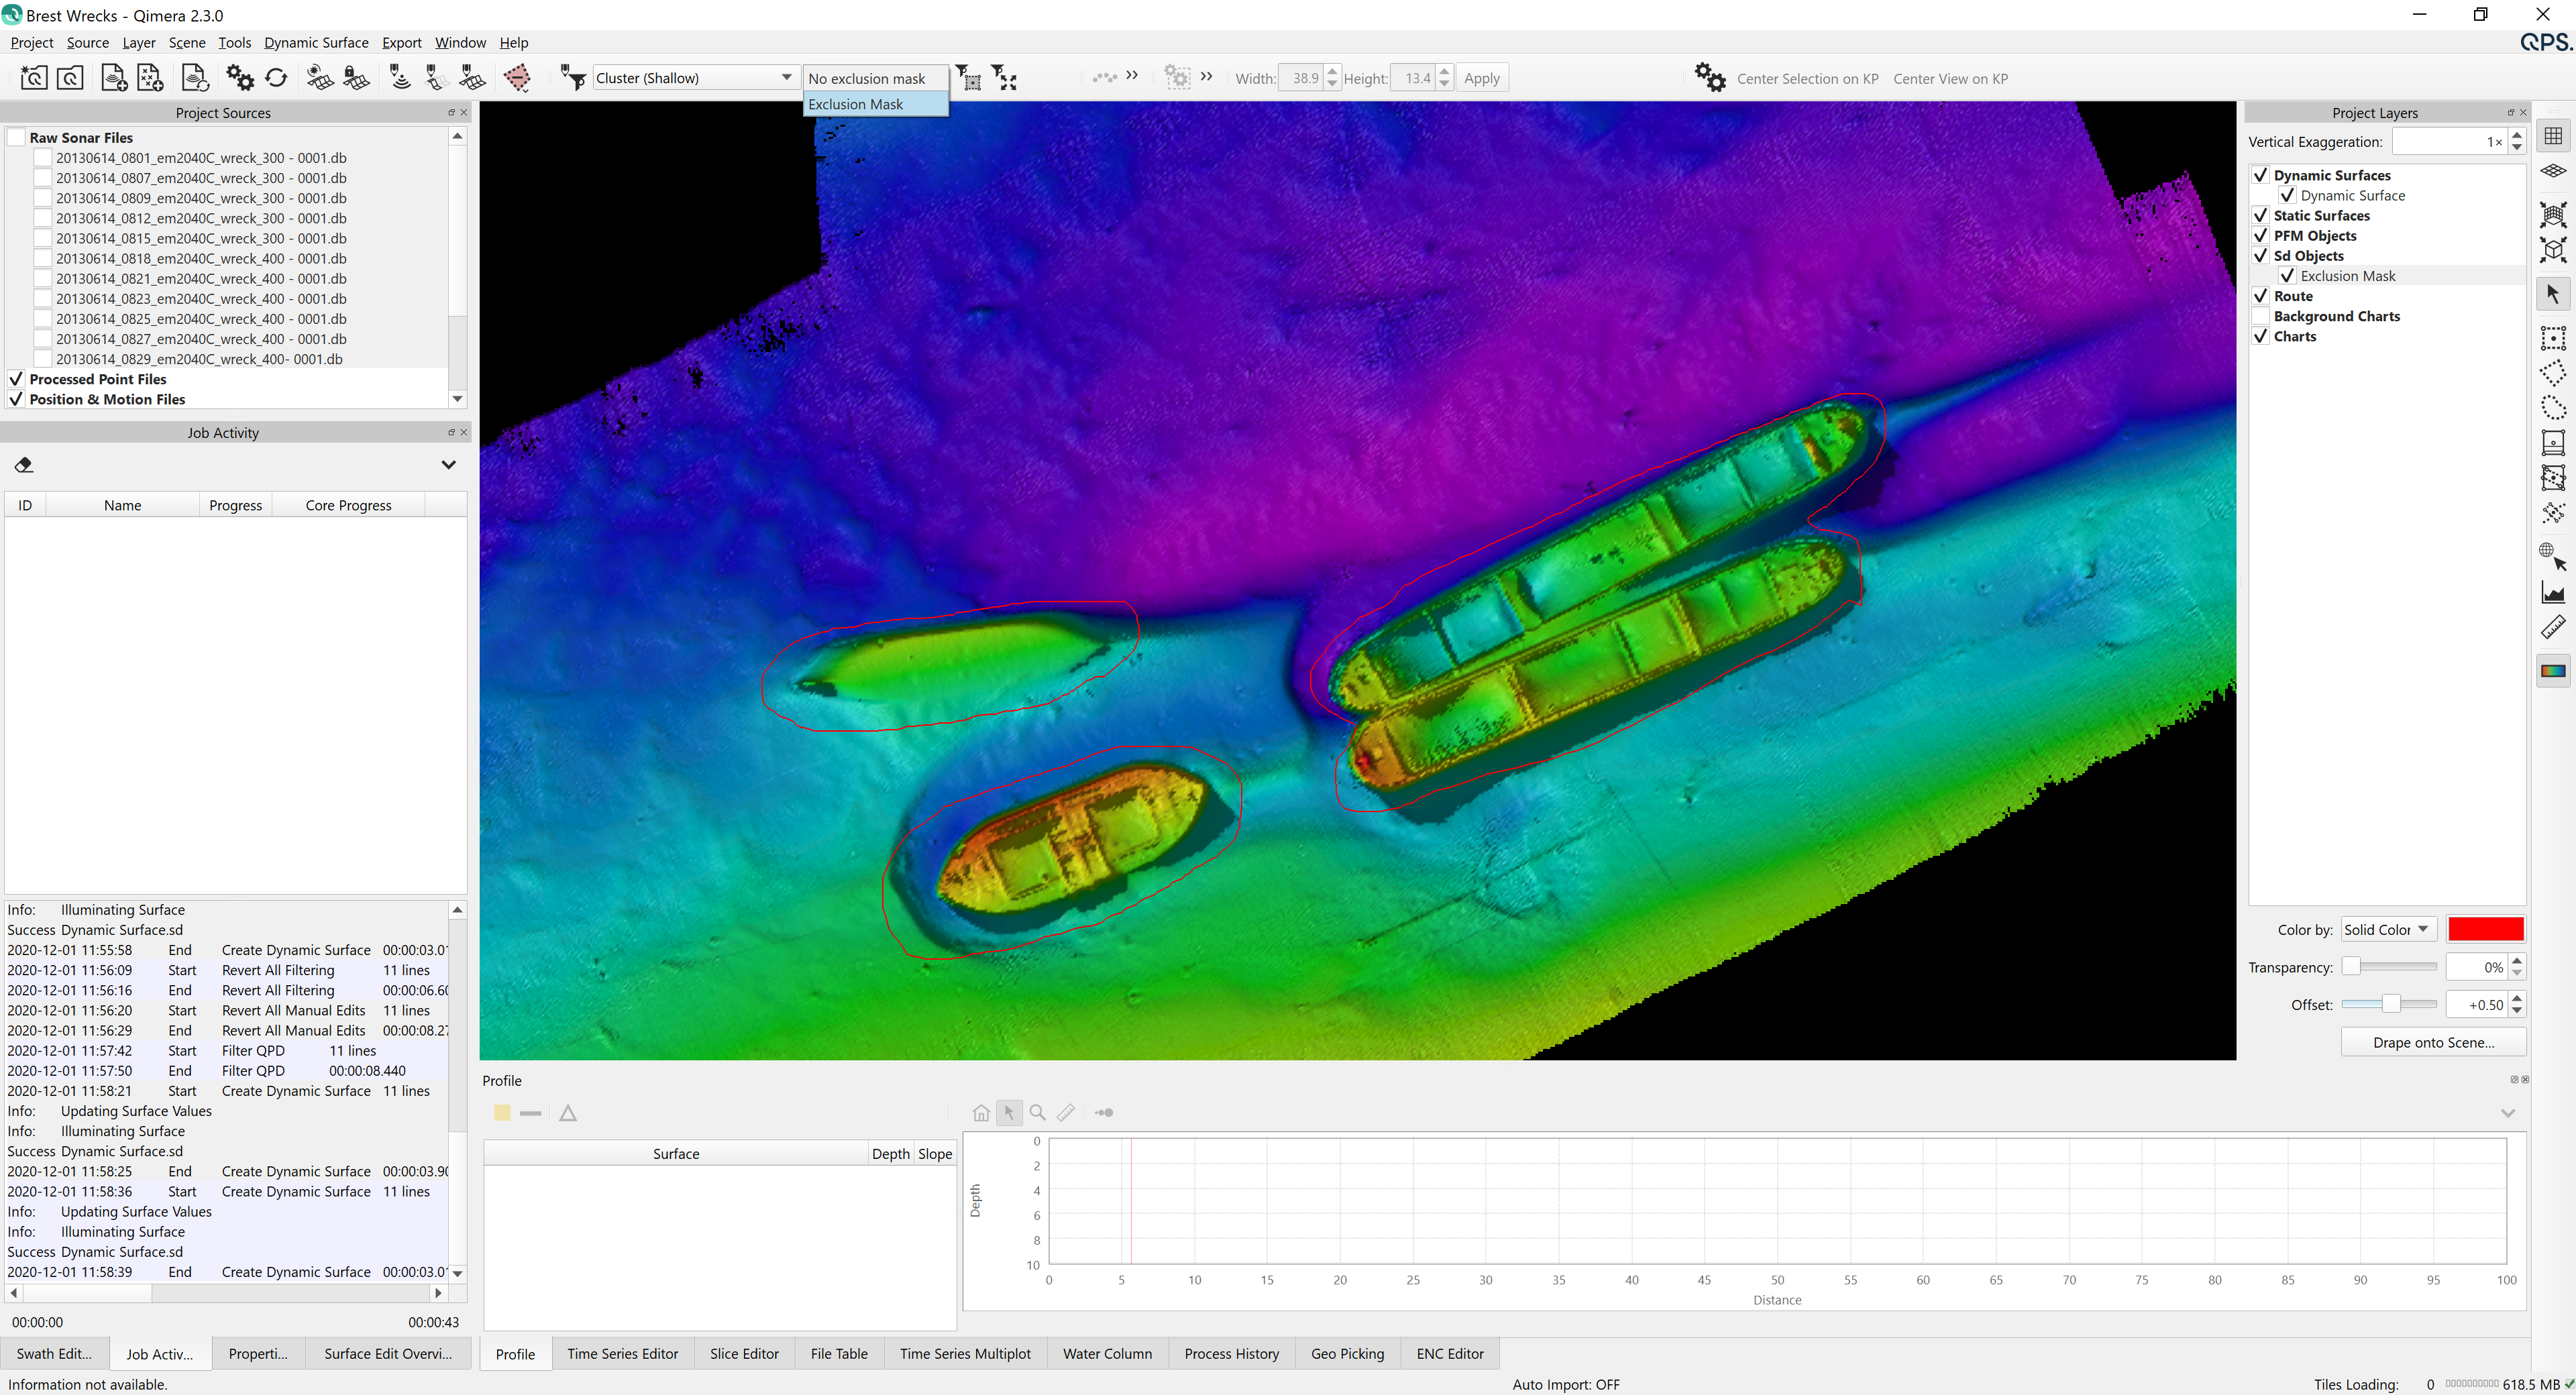
Once the multi-polygon exclusion mask is complete, it can be used as an Exclusion mask in a number of tools. Below you'll see how this is used in the Filter Toolbar to prevent running the Cluster filter over the wrecks where a manual inspection may be necessary to prevent points from being over-filtered.
Making Multi-Line Objects
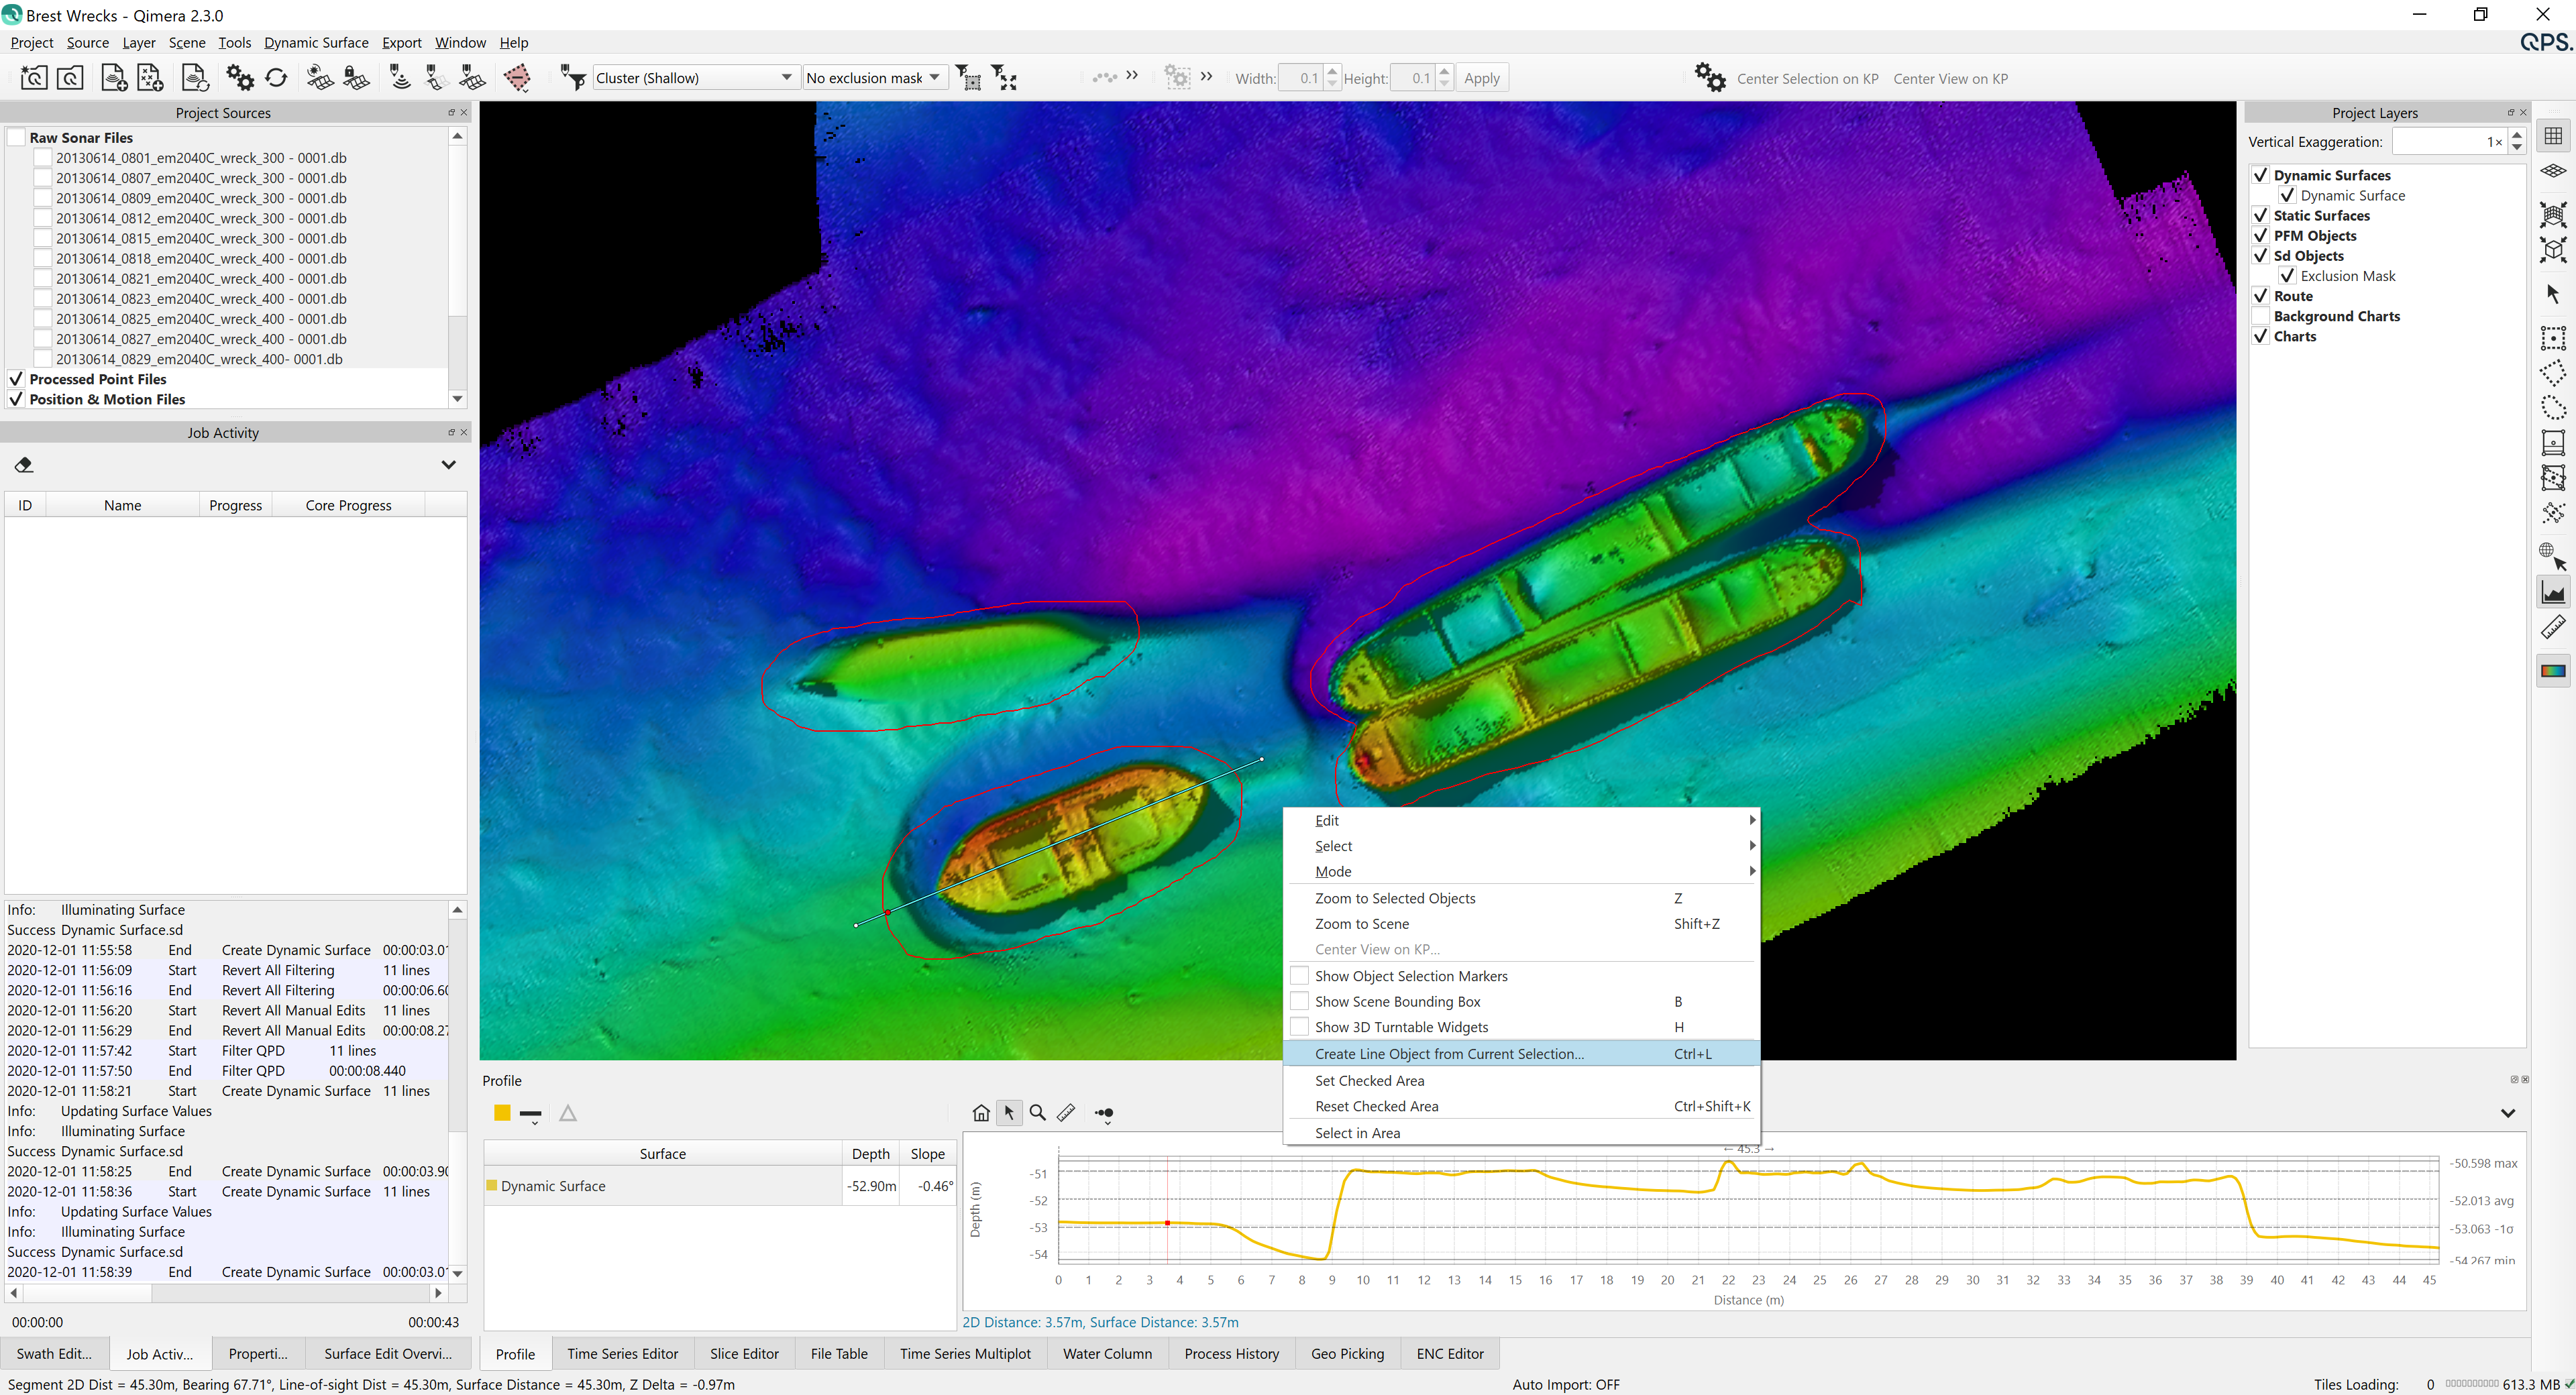
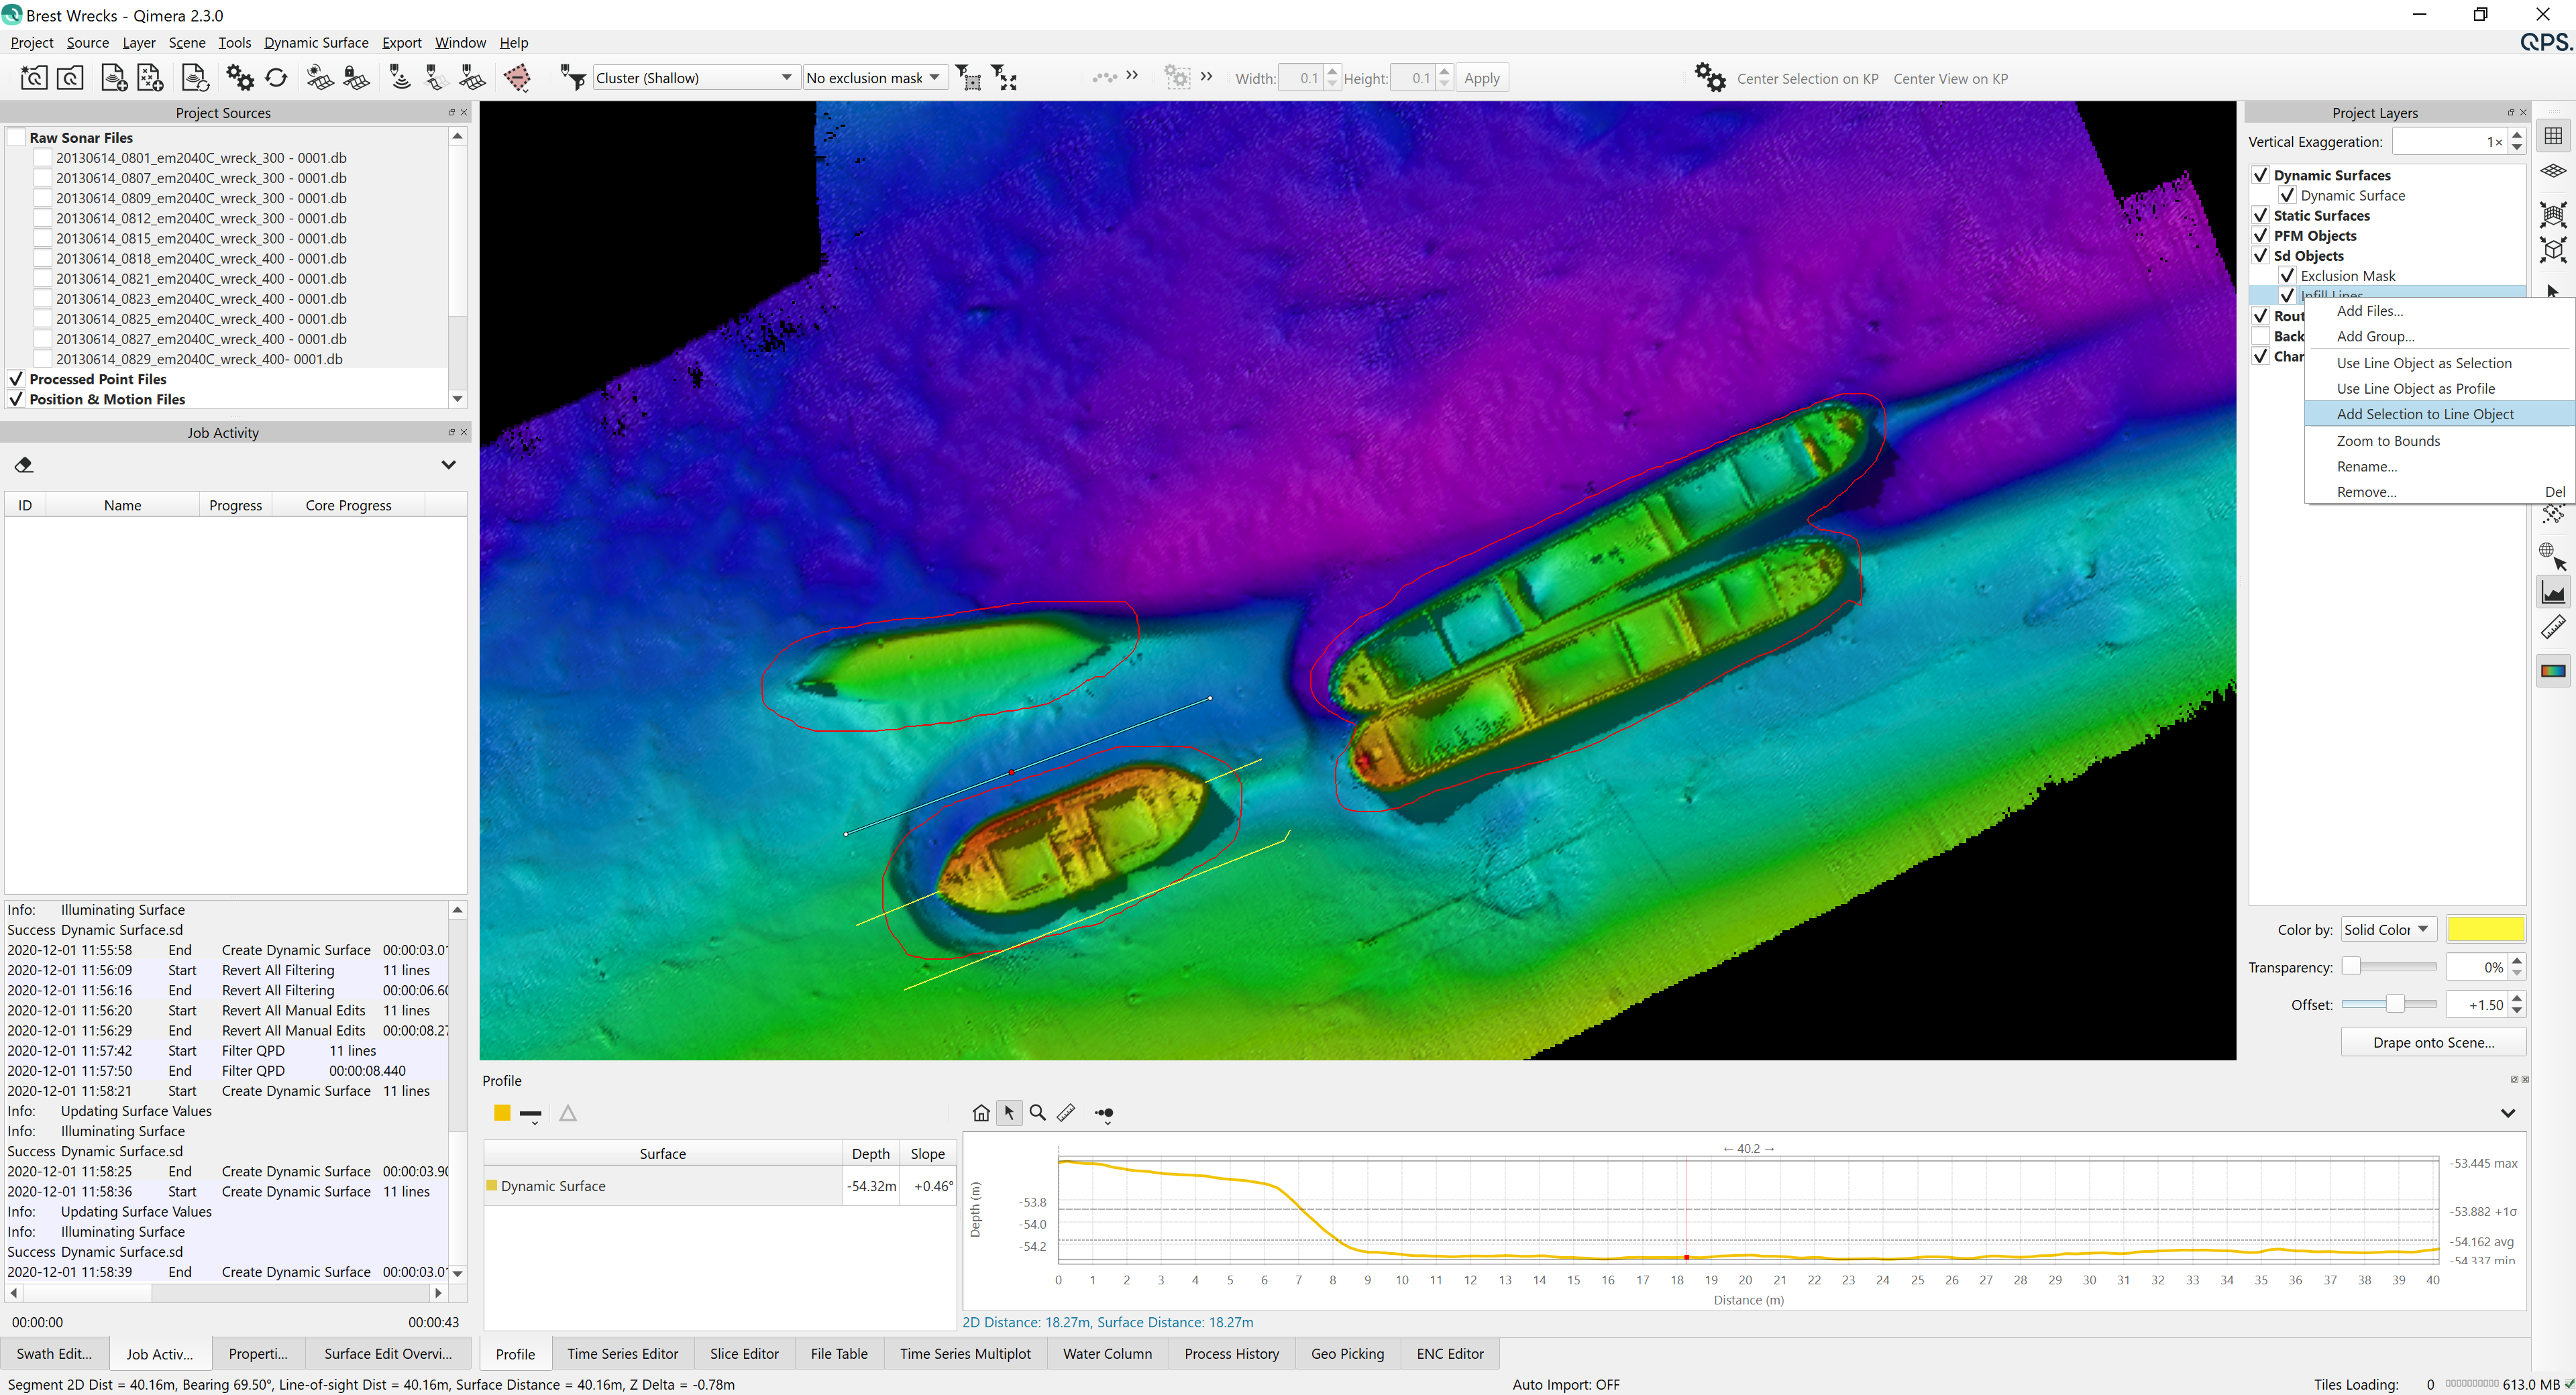
The image sequence below shows how you can use the Profile Tool to draw line objects and accumulate them into a single .sd object. In this example, you'll see that additional survey lines are being planned over a feature of interest with a line running over the center and then two winglines additionally to ensure that the feature is imaged completely on all three passes.
First, the profile tool is used to draw a line object, starting with left click and ending with right-click. Once the line is complete, an additional right-click will show the context menu and you use the same option to create a line object.
Additional lines are then drawn and then added to the exiting line object using the same right-click context menu as was done with multi-polygon creation.
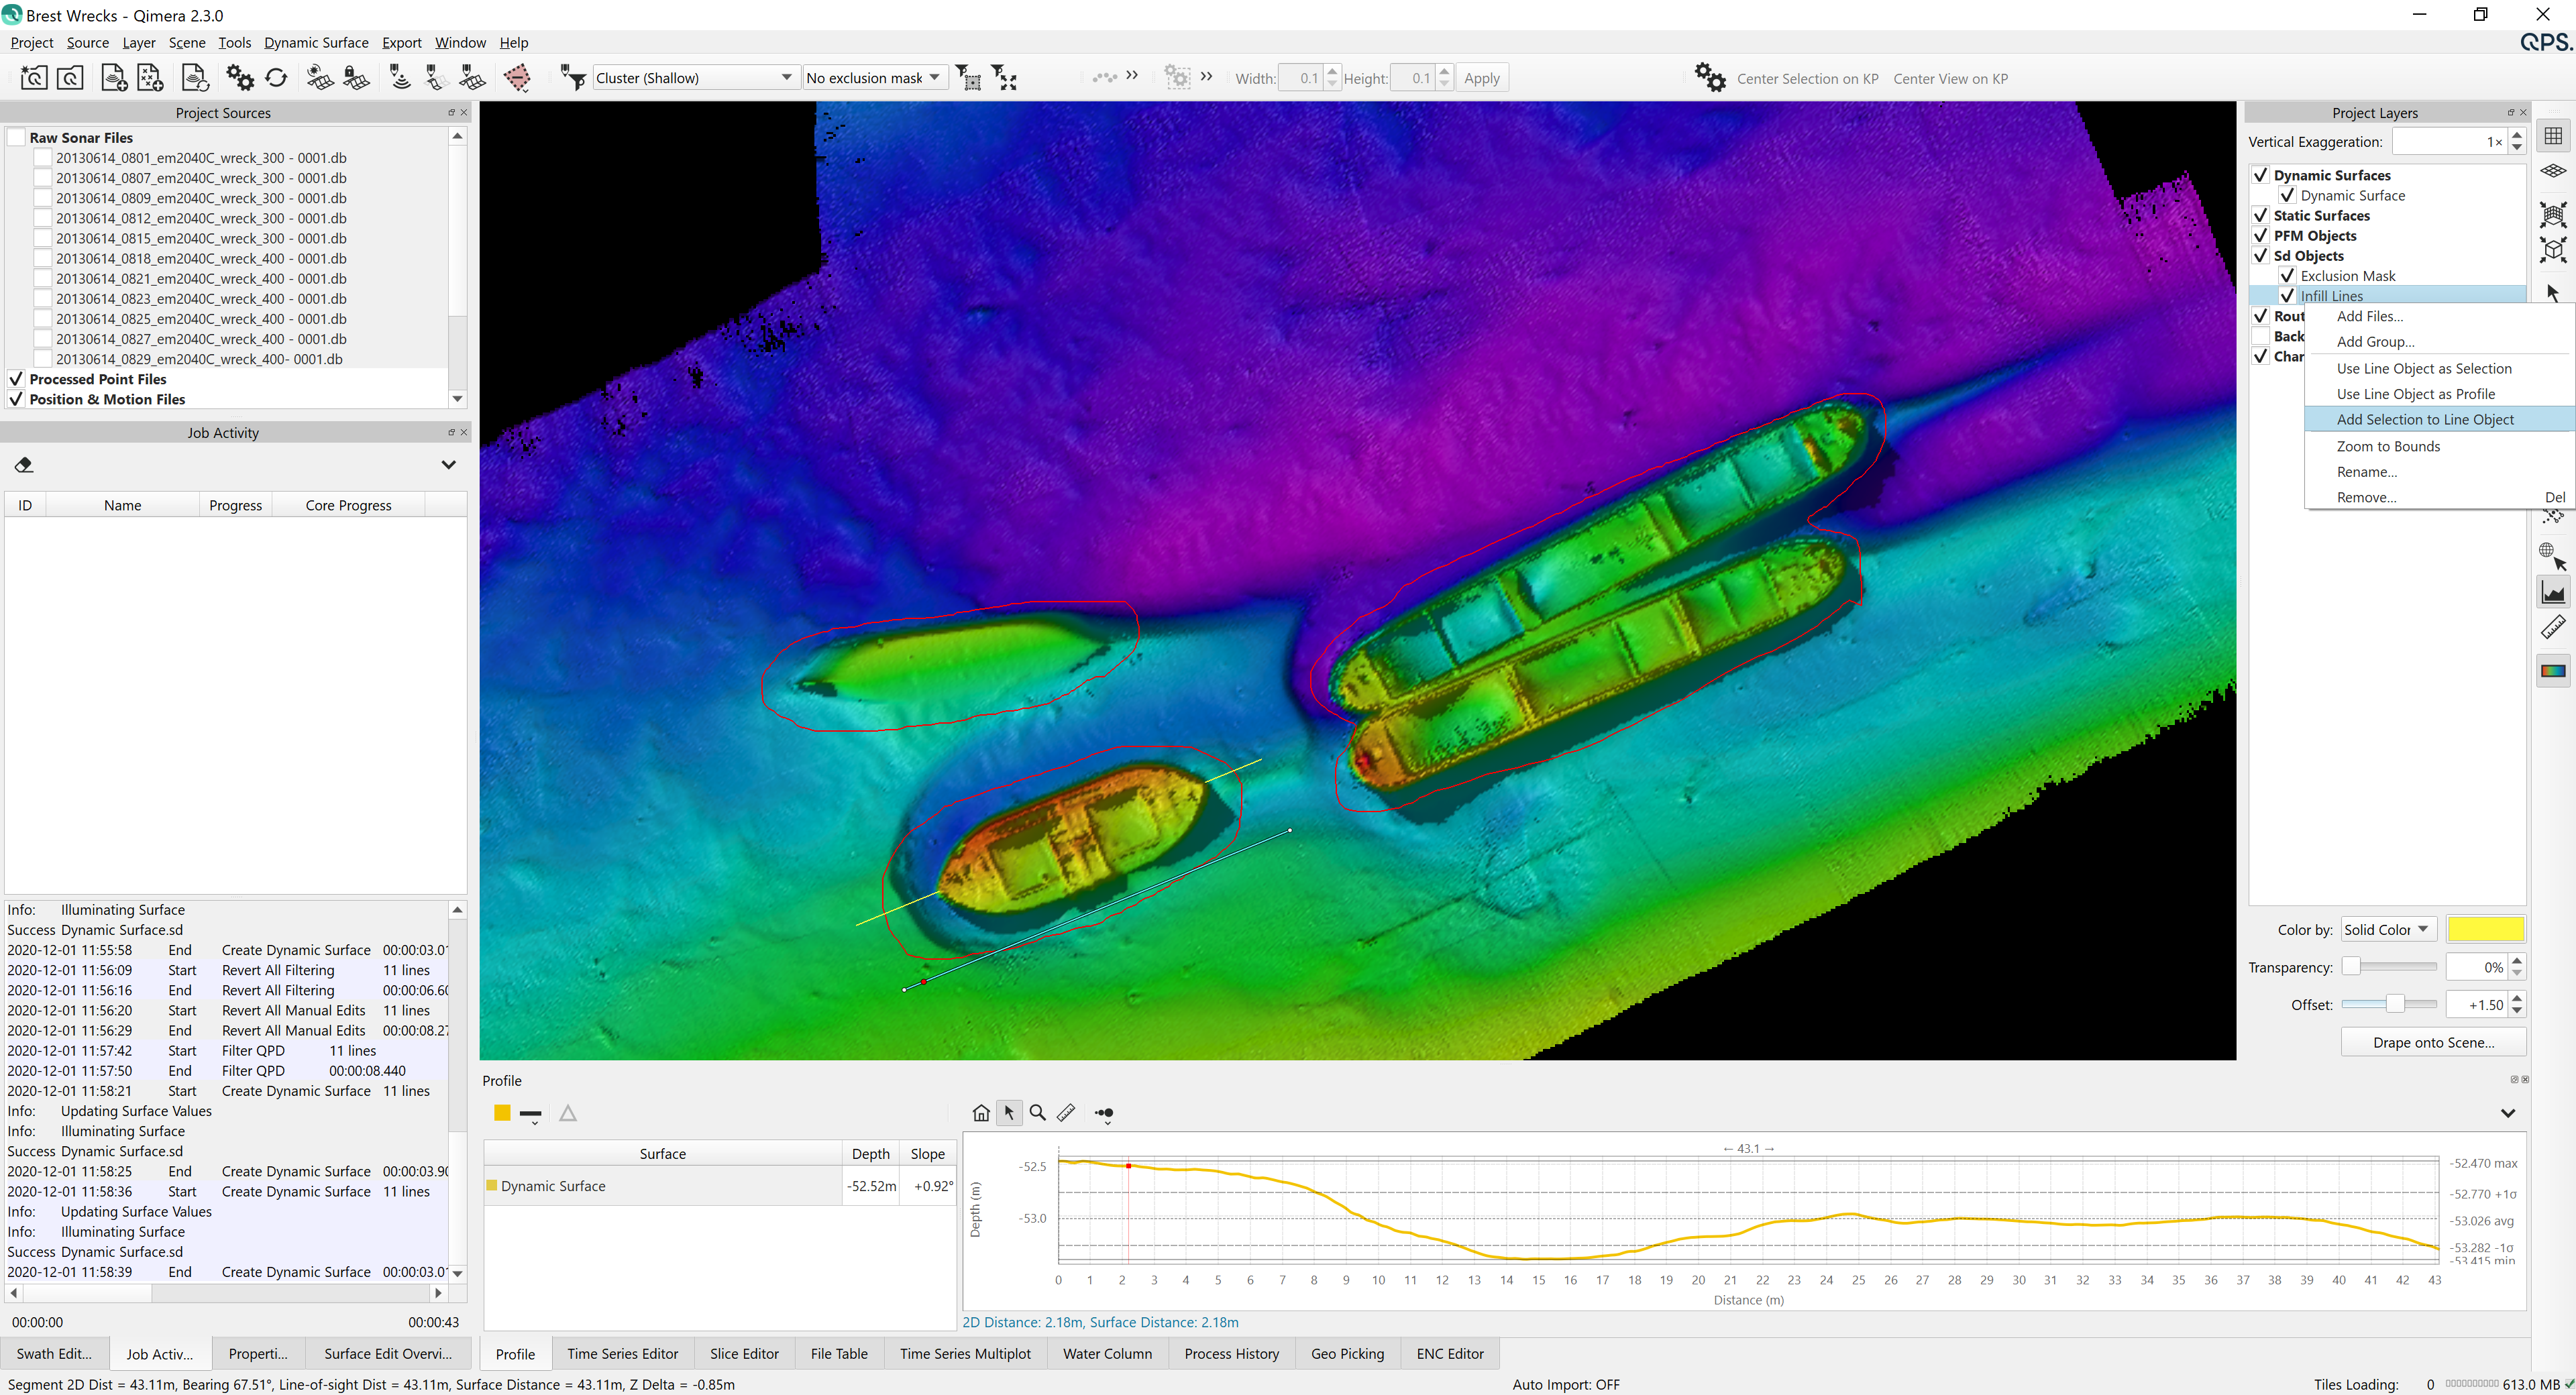
The third line is added finally for the complete set of survey lines to pass to the online surveyor.
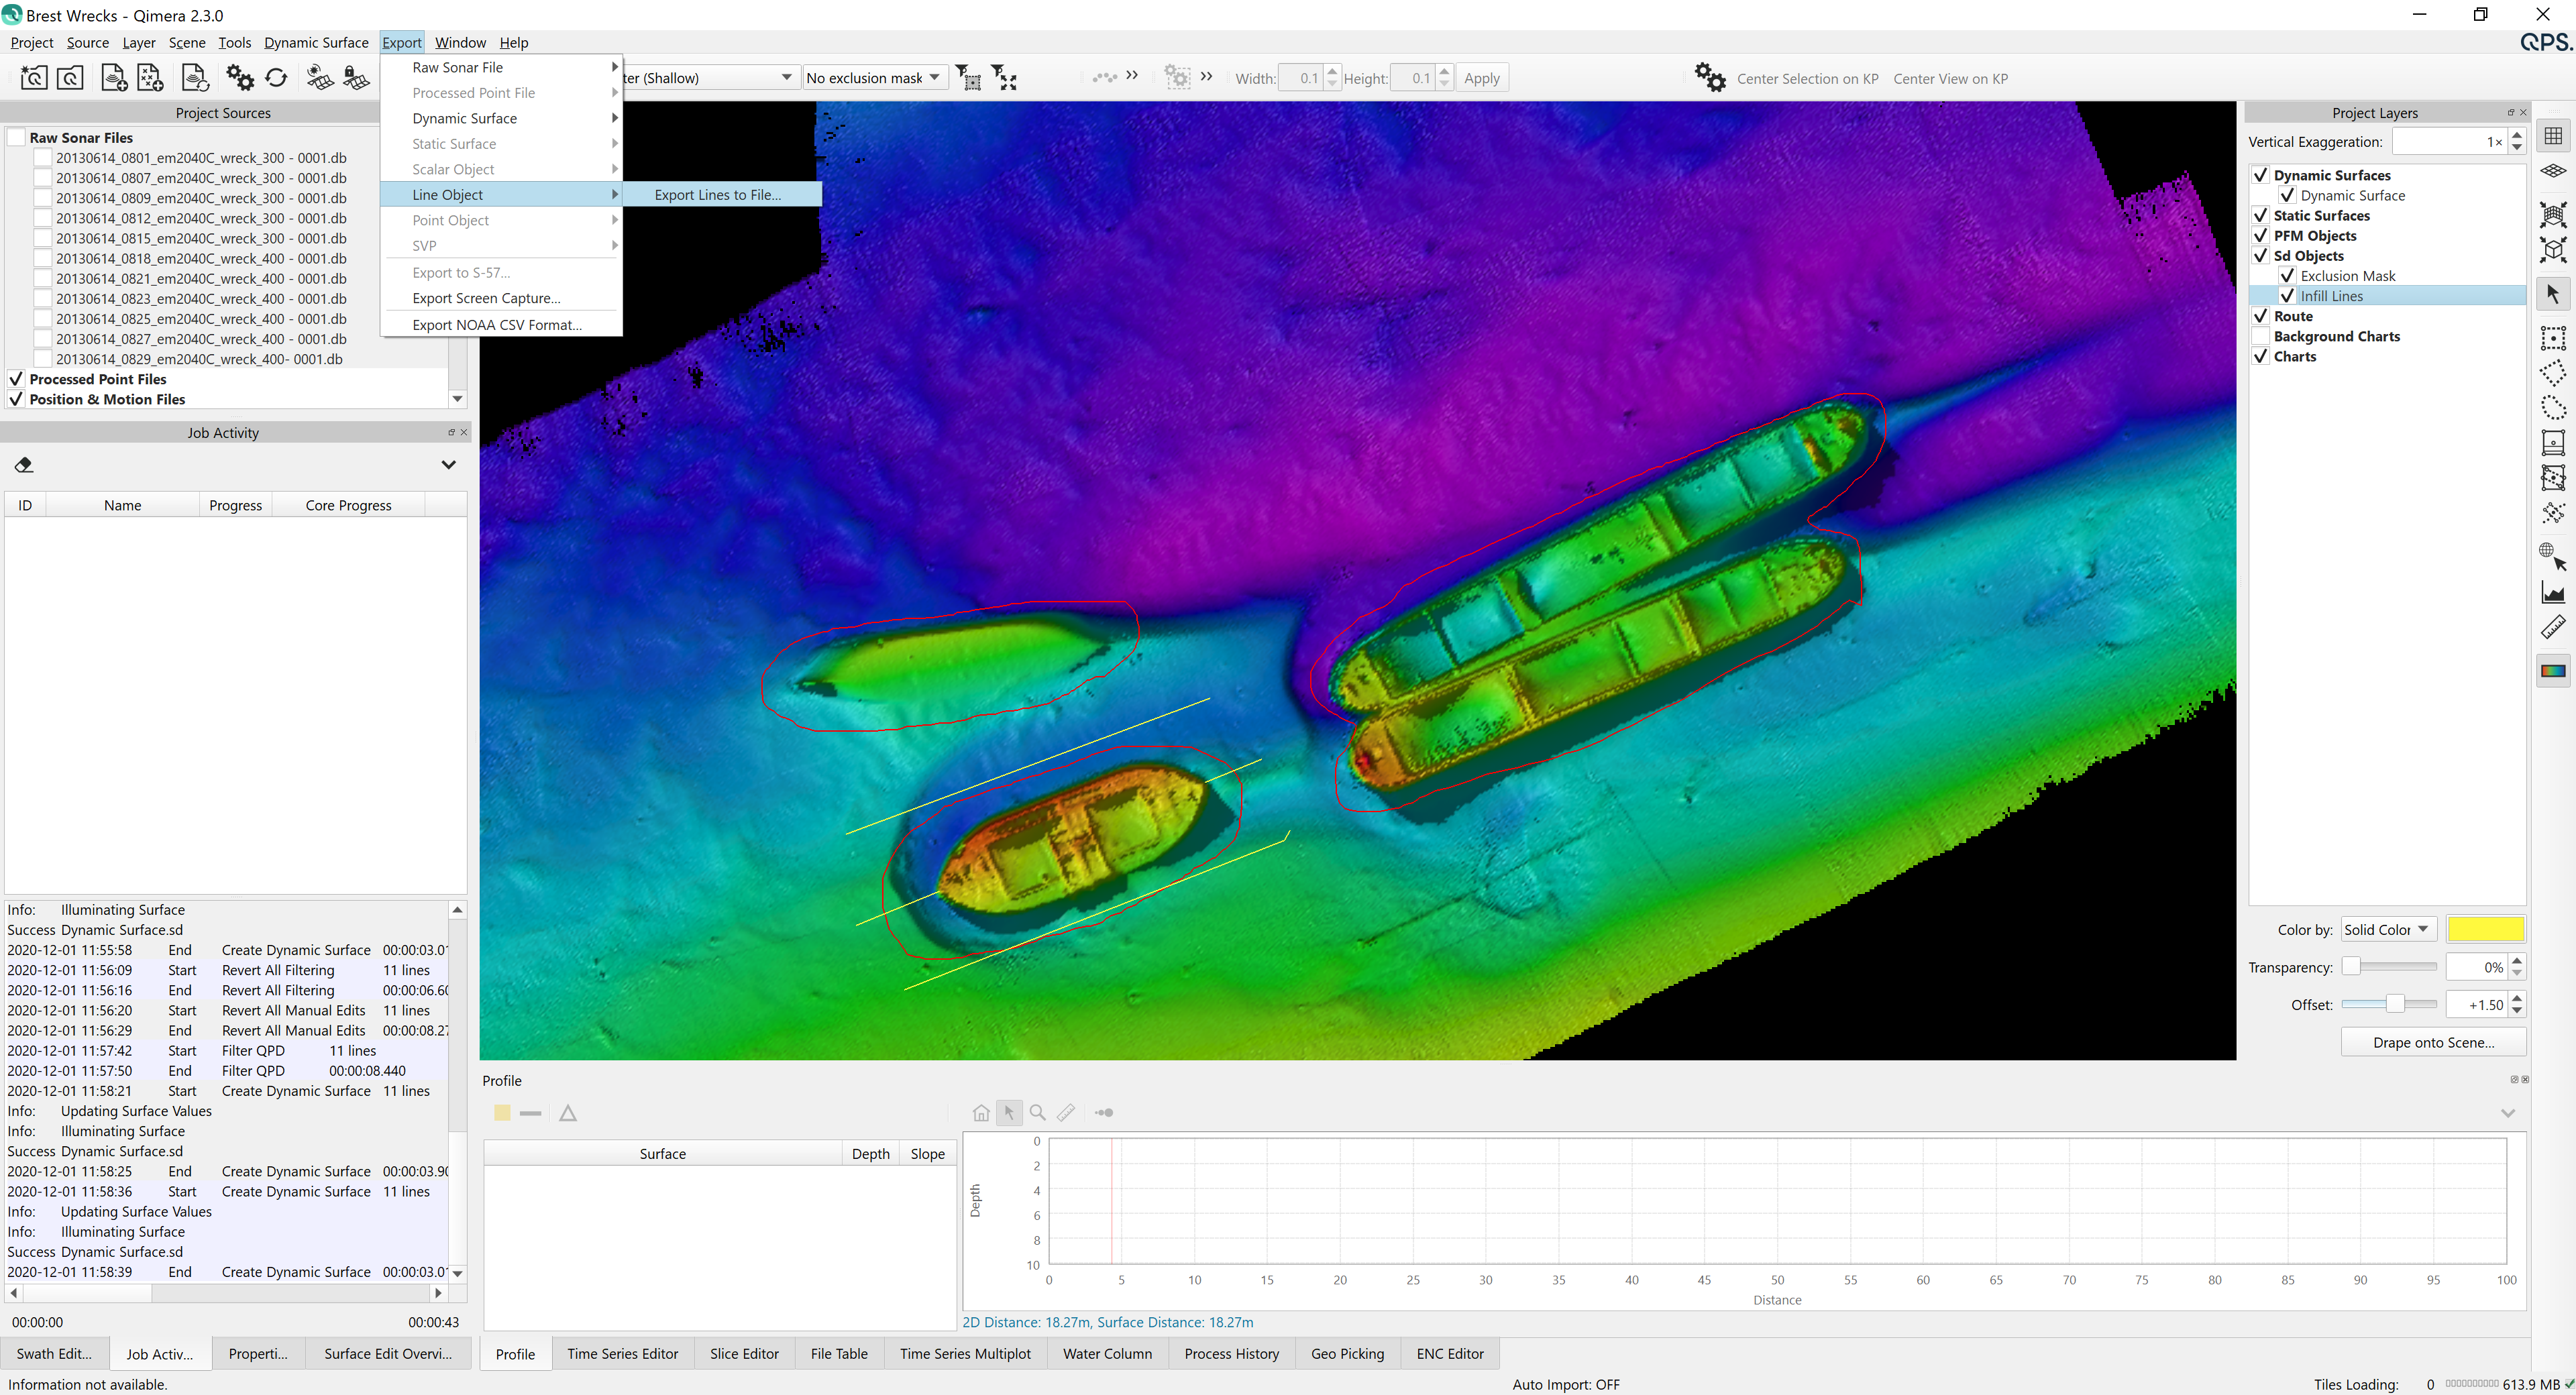
The line object is then exported, currently DXF and DWG are supported.
Interface and User Experience Improvements
Slice Editor and 3D Editor
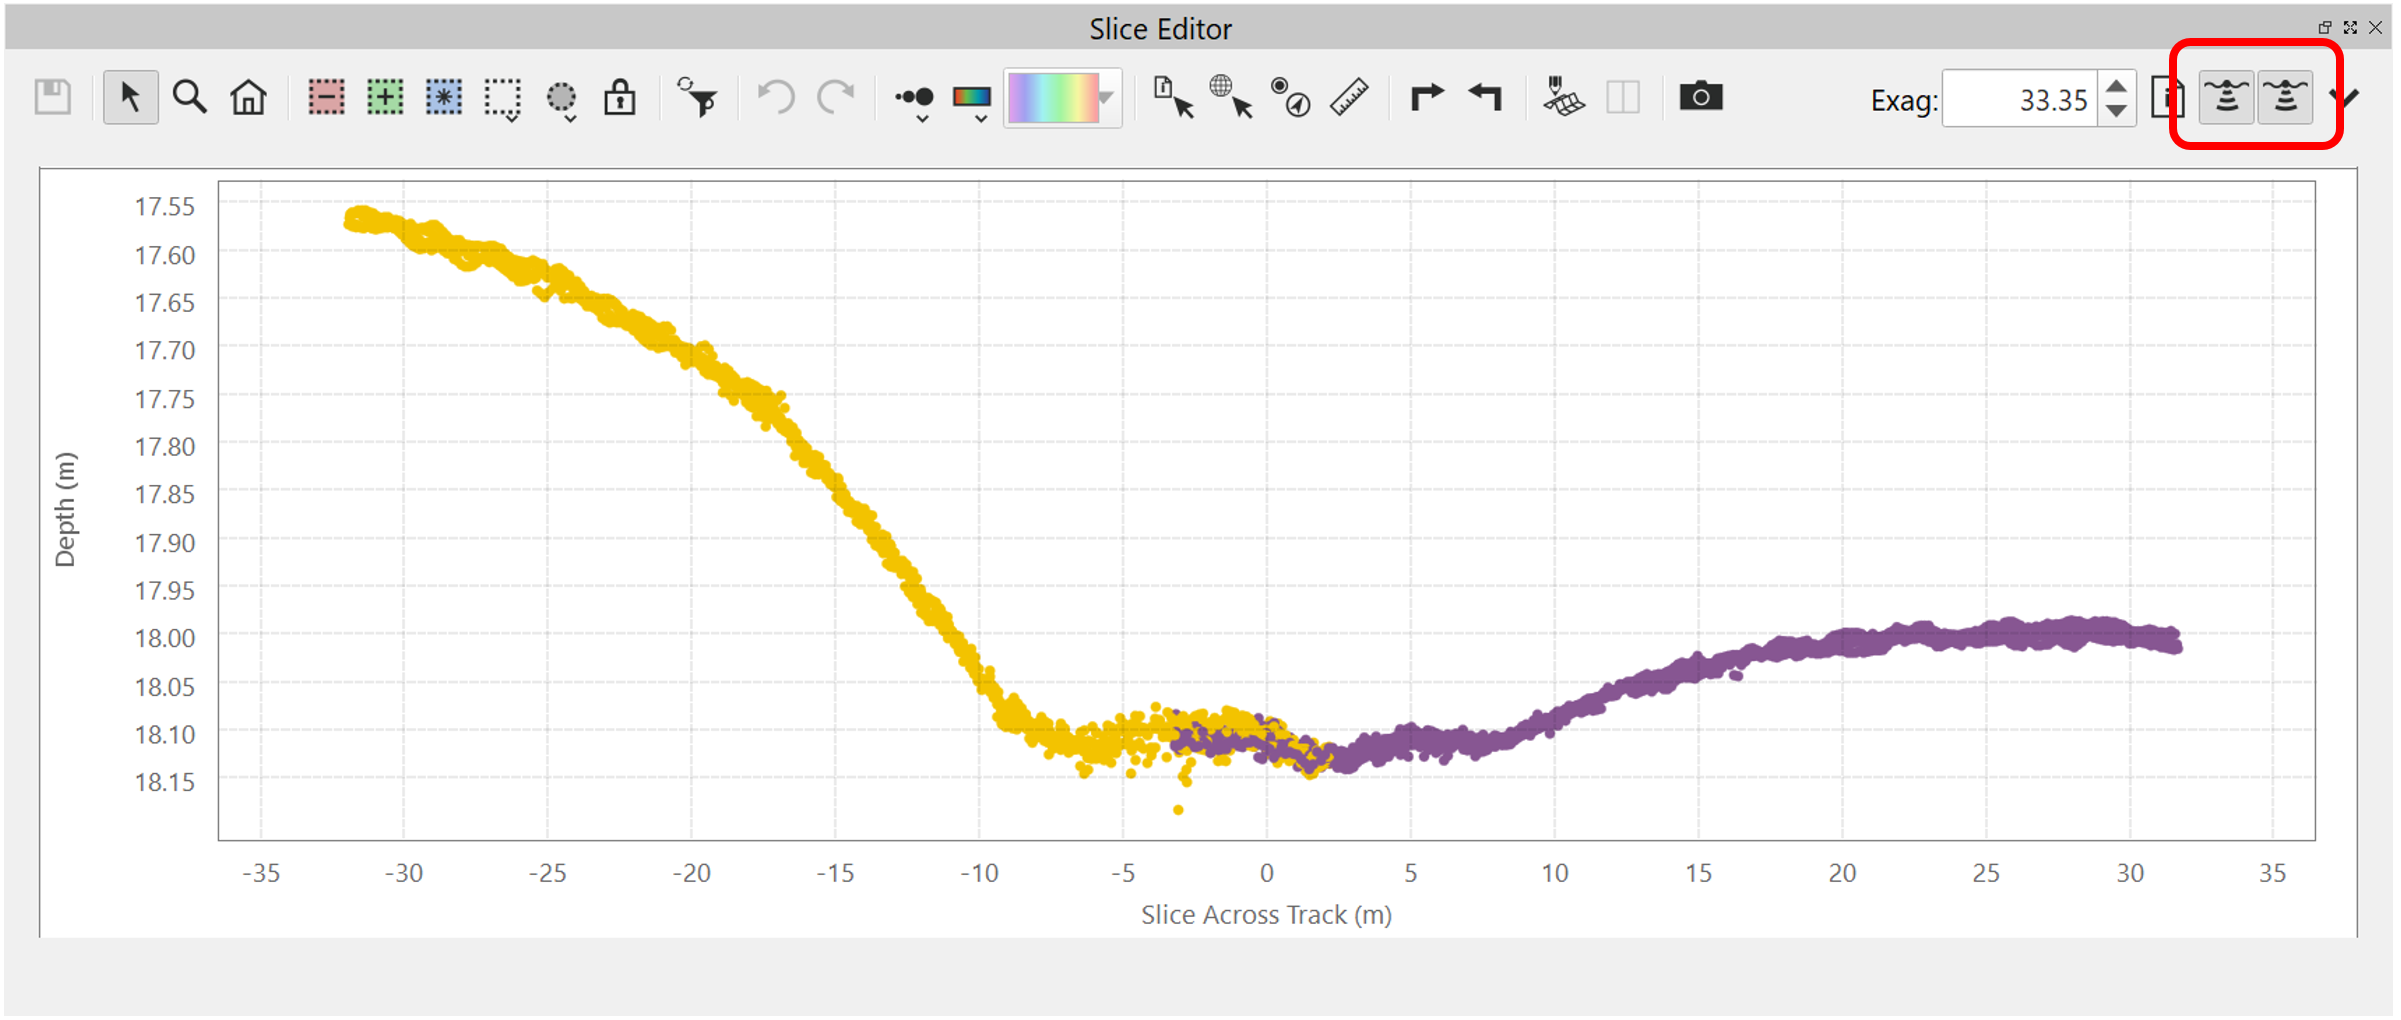
There are now head toggle buttons to allow users to enable/disable plotting of data from each system in the Slice Editor, see below. This brings the same user experience that was in the Swath Editor over to the Slice Editor.
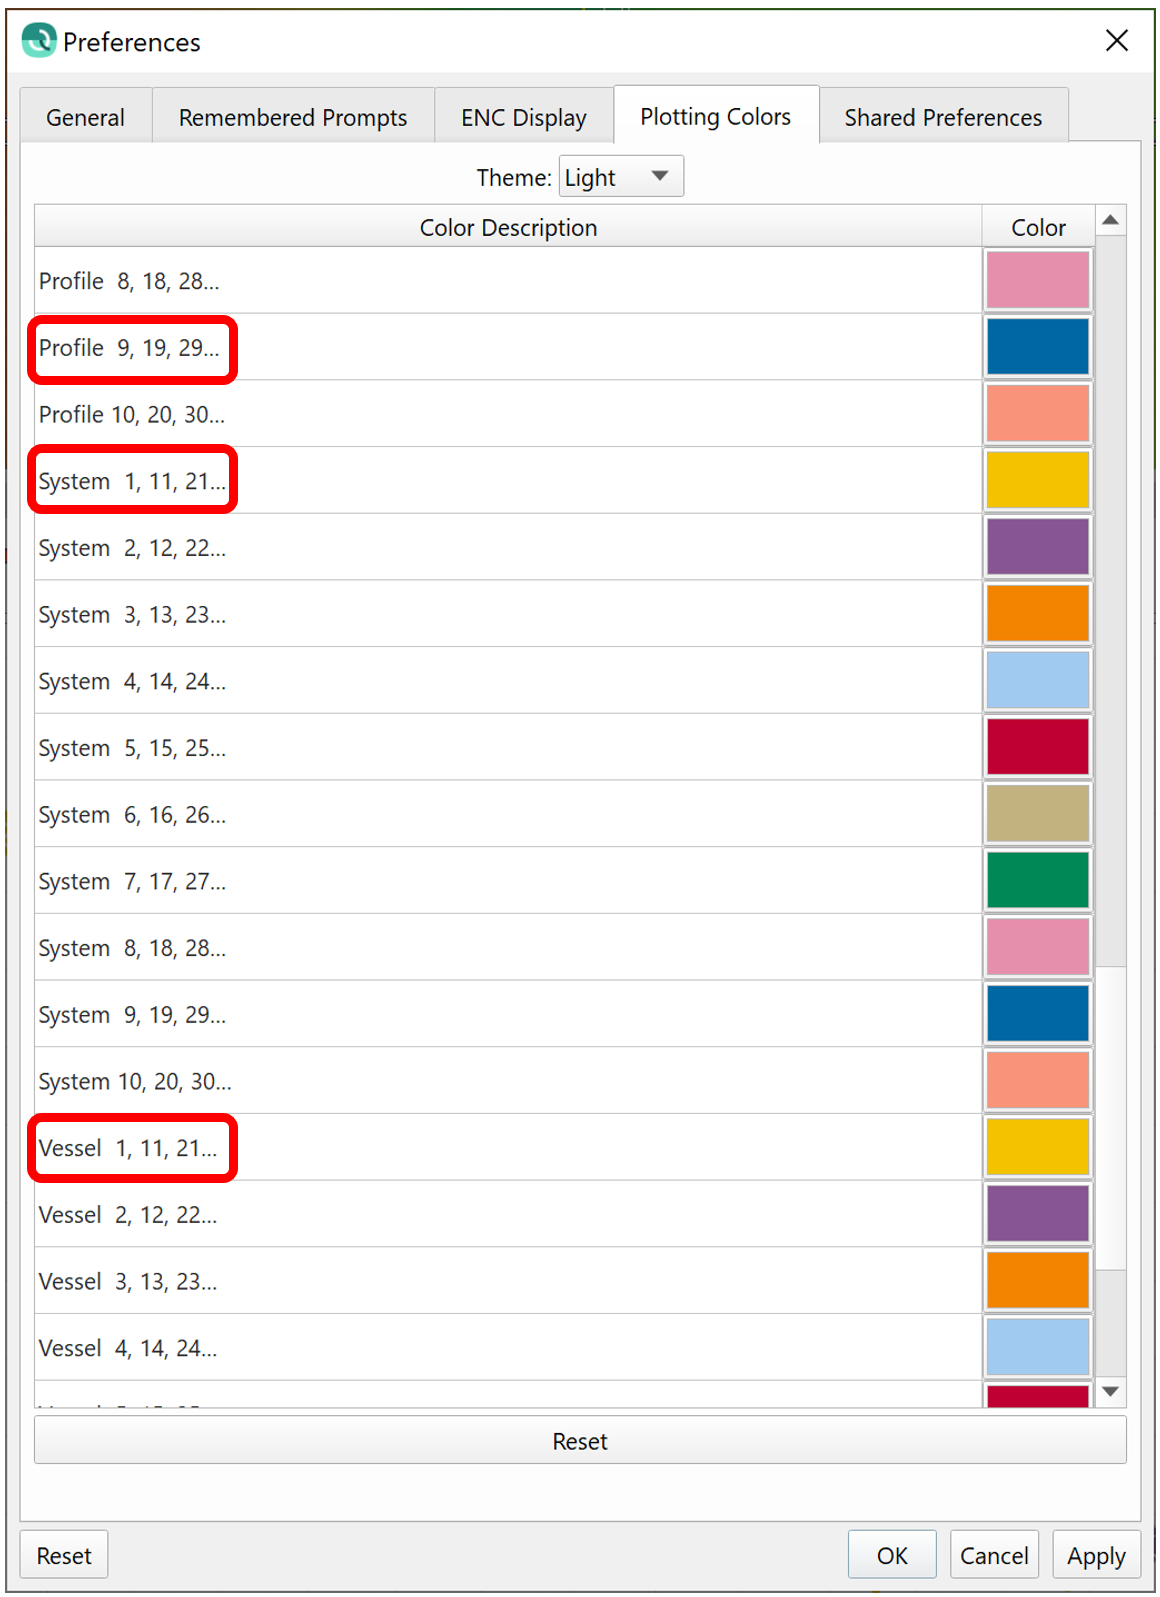
Colors for different systems, vessels and profiles can be configured in the main Preferences, this allows more control over coloring when coloring by multiple systems or multiple vessels or when examining profiles across multiple surfaces in the profile tool.
Lastly, for the 3D Editor, existing with the '3' keyboard shortcut will now prompt you to save your edits first.
Time-Series Multiplot
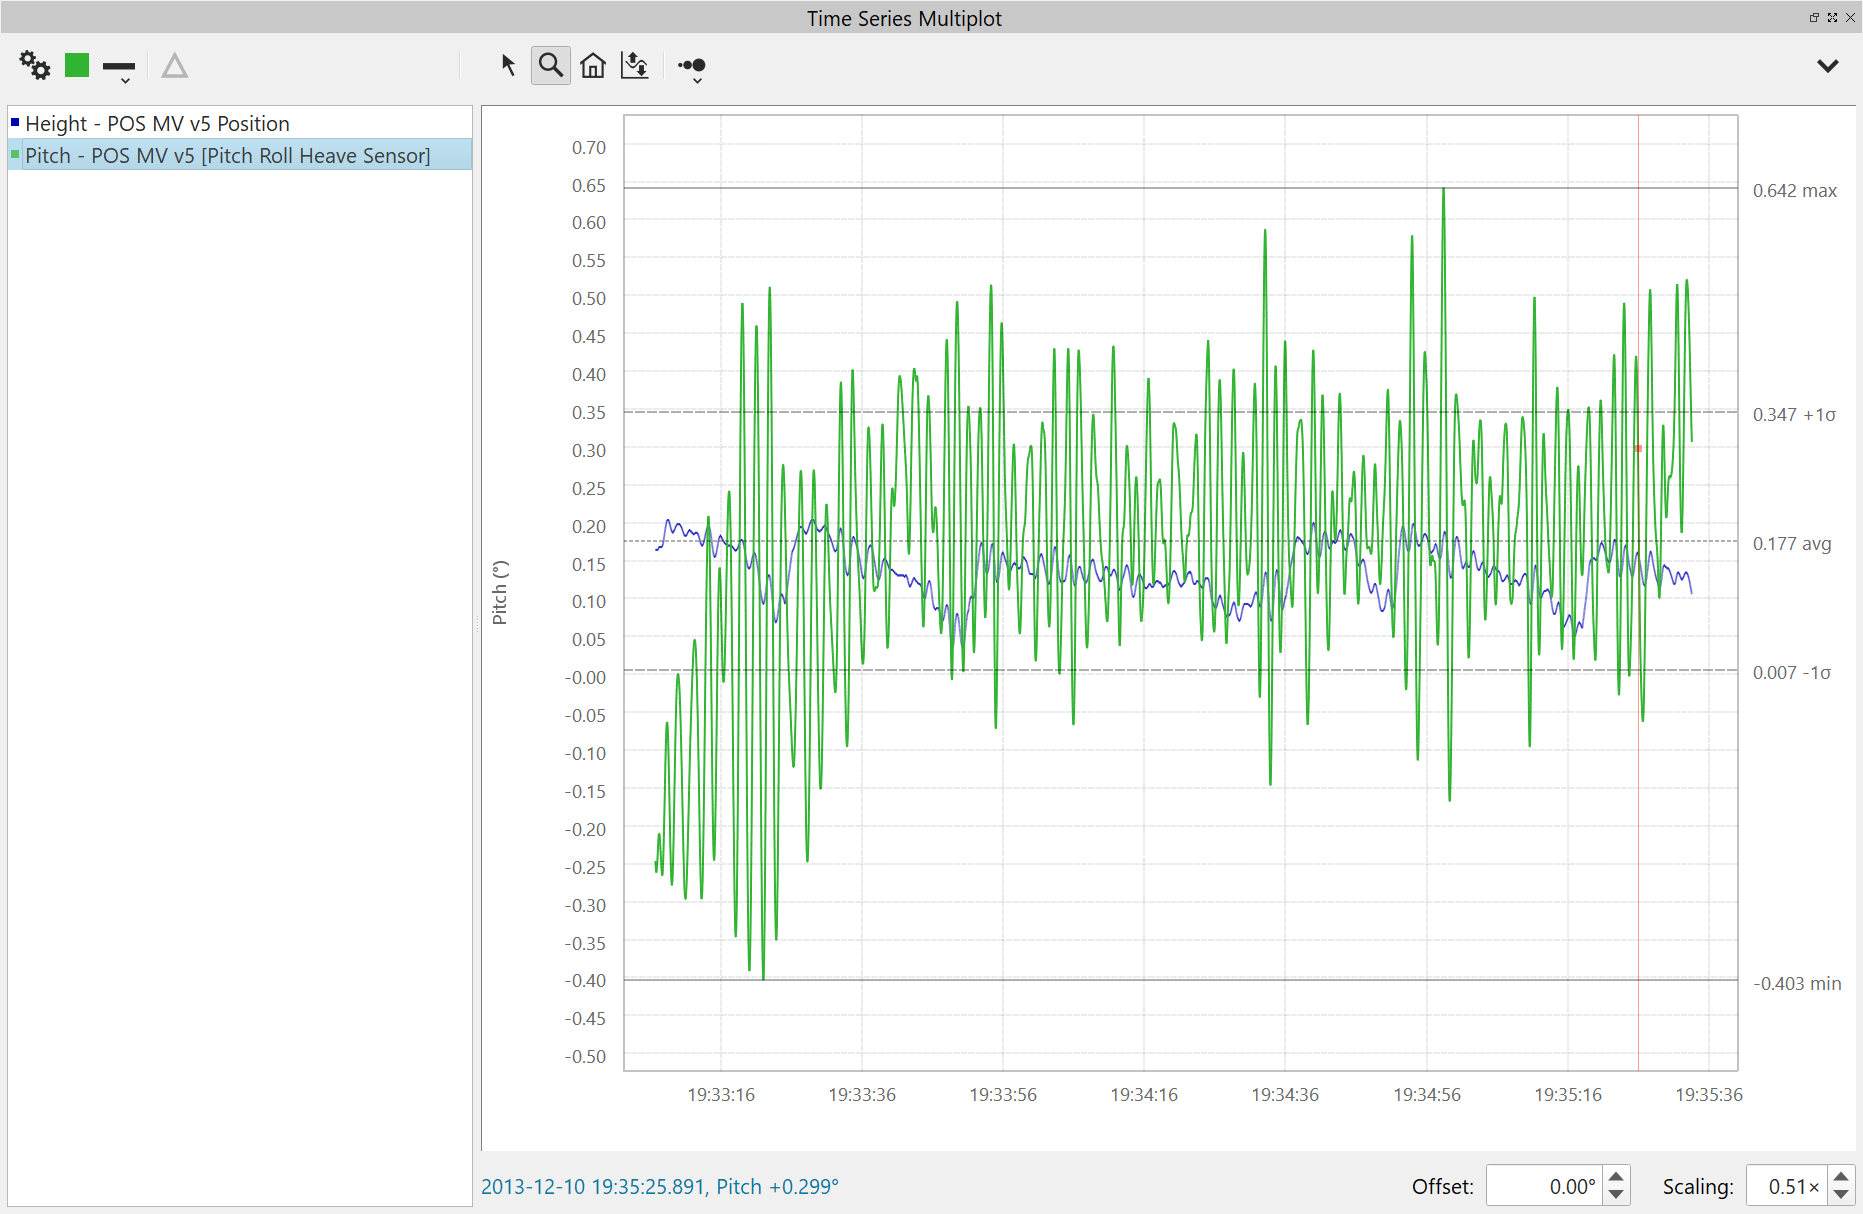
Statistics about the time-series can be shown, with an option to enable/disable in the dock's context menu. You can show mean, minimum, maximum and also +/- 1-sigma for the primary selected time-series. Also, ASCII exports of single time-series or merged time-series now have consistent time stamp format.
Filter Toolbar
As part of our work to add the ability to specify exclusion masks, we simplified the Filter Toolbar. Note that the Exclusion Mask combo box gets populated automatically when you create polygon .sd objects or when you import CAD files that contain polygon objects. Since an Exclusion Mask can now be specified, we've removed the button that allows for filtering OUTSIDE of a selection. The exclusion mask can collect many potential areas of exclusion and is thus more flexible and powerful then the previous method which only allowed filtering outside of a single polygon object. In its place, the second combo box on the toolbar now lets you choose an exclusion mask or no mask at all. We've removed the ability to filter selected files from the second combo box as well (this can still be done, see below), this led to confusion for many users. With these small changes, the toolbar is now focused on working on a Dynamic Surface only, which of course will filter all of the underlying point files that contribute to the surface.
Old toolbar

New toolbar

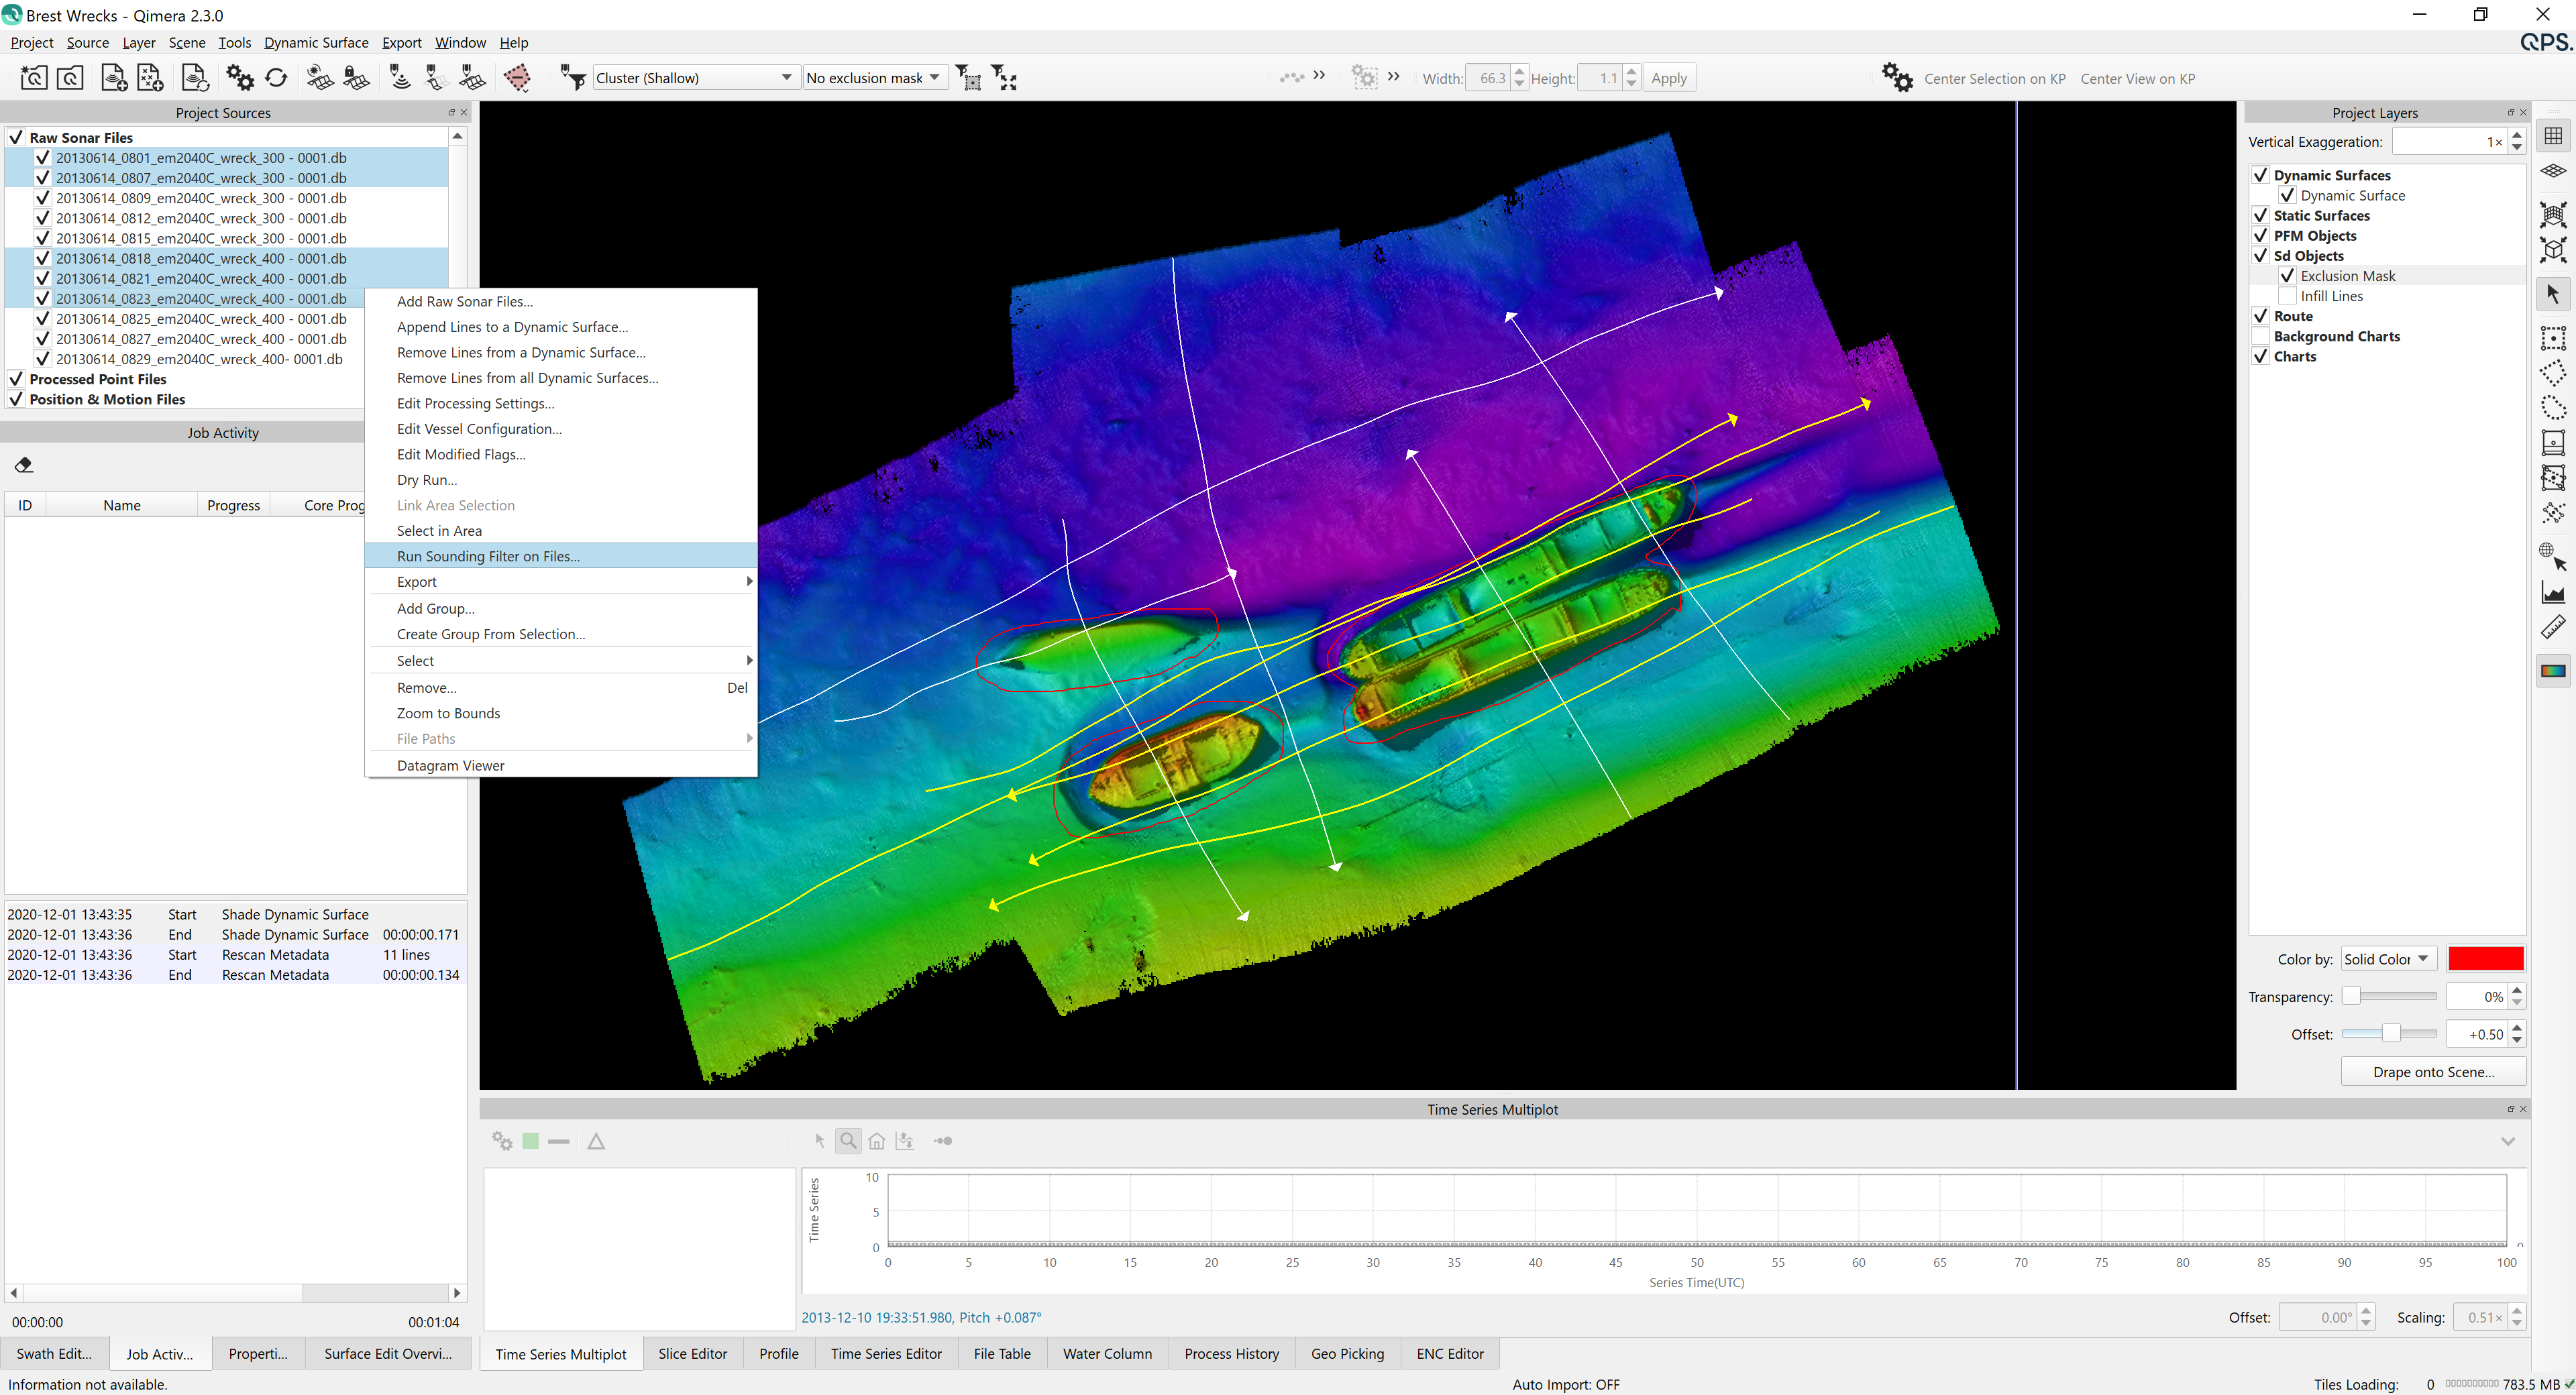
If you want to apply a filter to a particular set of files, you select the files as usual in the Project Sources dock, and then right-click on those files and choose to run a filter. See the image sequence below as an example.
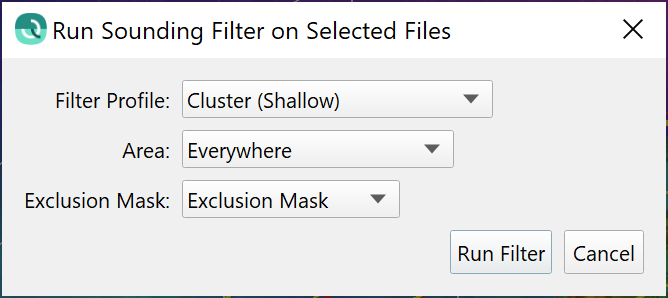
Once you select the option to filter your files, a dialog will appear that lets you choose which filter to run, which area to run it in and finally whether or not to use an Exclusion Mask.
Profile Tool
Like shown previously for the time-series editor and multiplot docks, statistics can be displayed for a profile: minimum, maximum, mean and +/- 1-sigma. When setting custom colors for surfaces, these settings are cached when profiling multiple surfaces and choosing custom colors. Furthermore, as shown earlier with the ability to set custom colors for vessels and systems, you can also set custom default colors used for profiles when profiling across multiple surfaces.
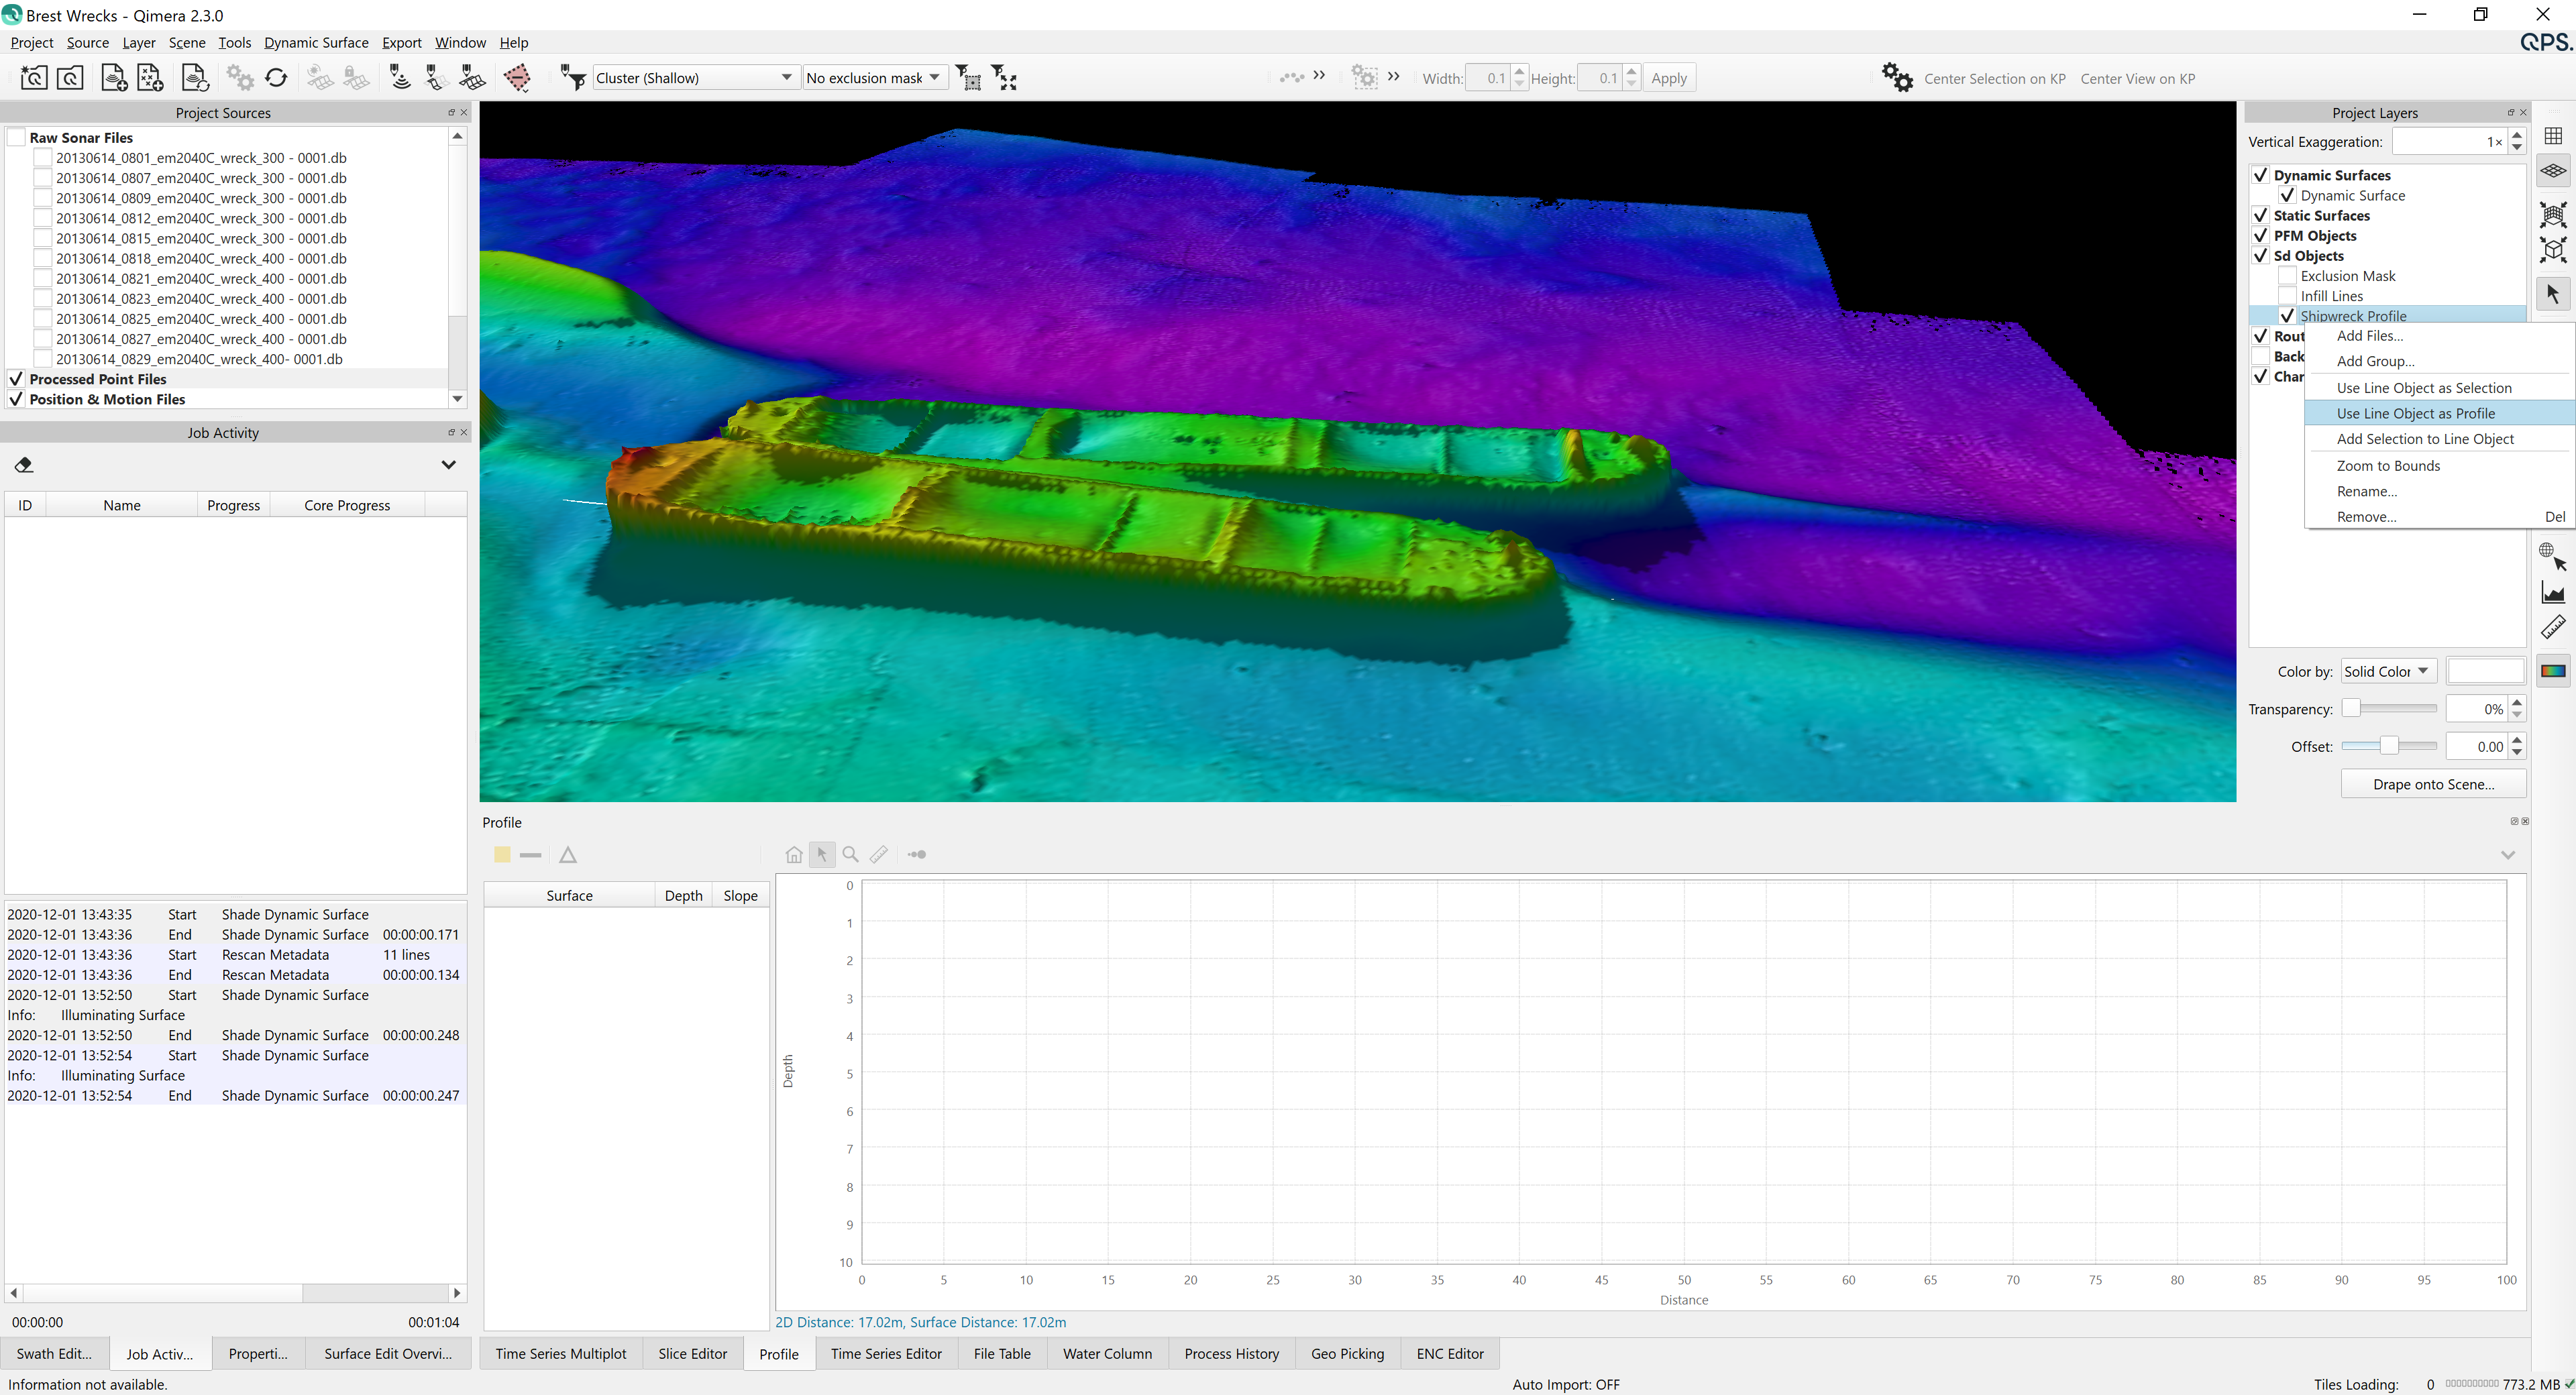
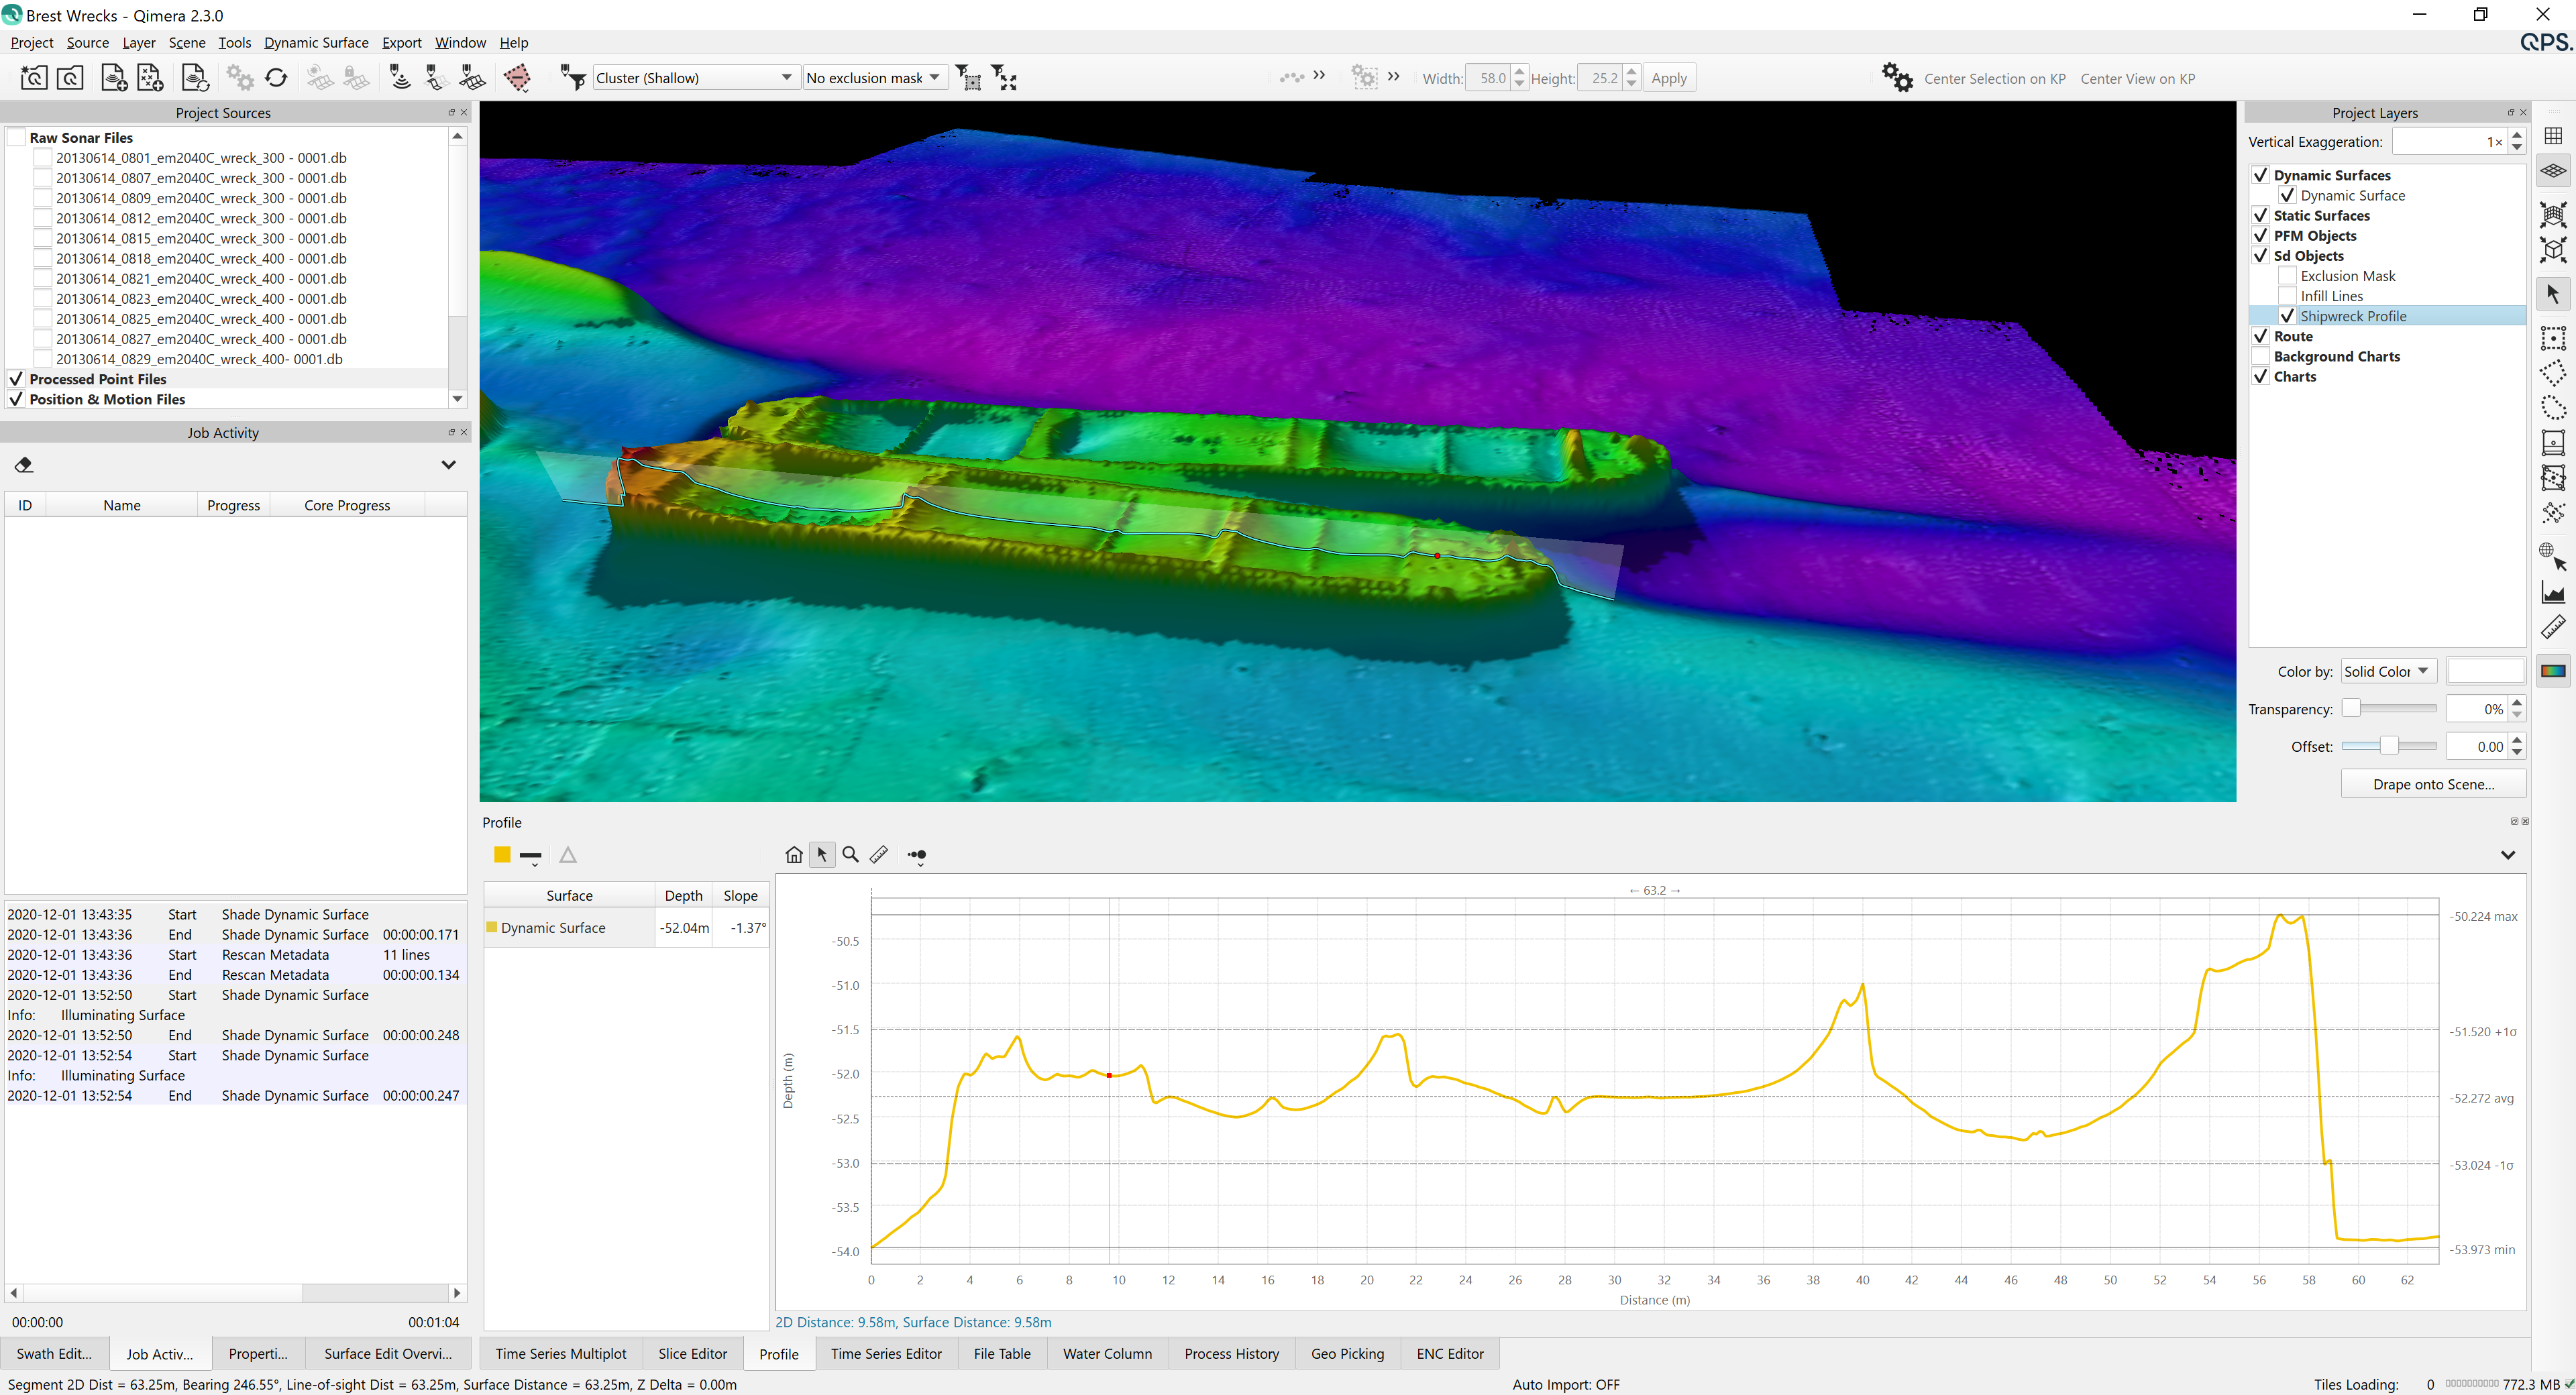
In earlier images above, we showed that it's possible to use the profiling tool to create custom line objects and to collect them into a single .sd file. In this release, you can also save a profile line and then select it for re-use for profiling. This is helpful when you want to ensure that you are taking the same profile measurements in different processing or analysis sessions. The image sequence below shows how this works, starting with creating a .sd object from a profile that is drawn in the Scene.
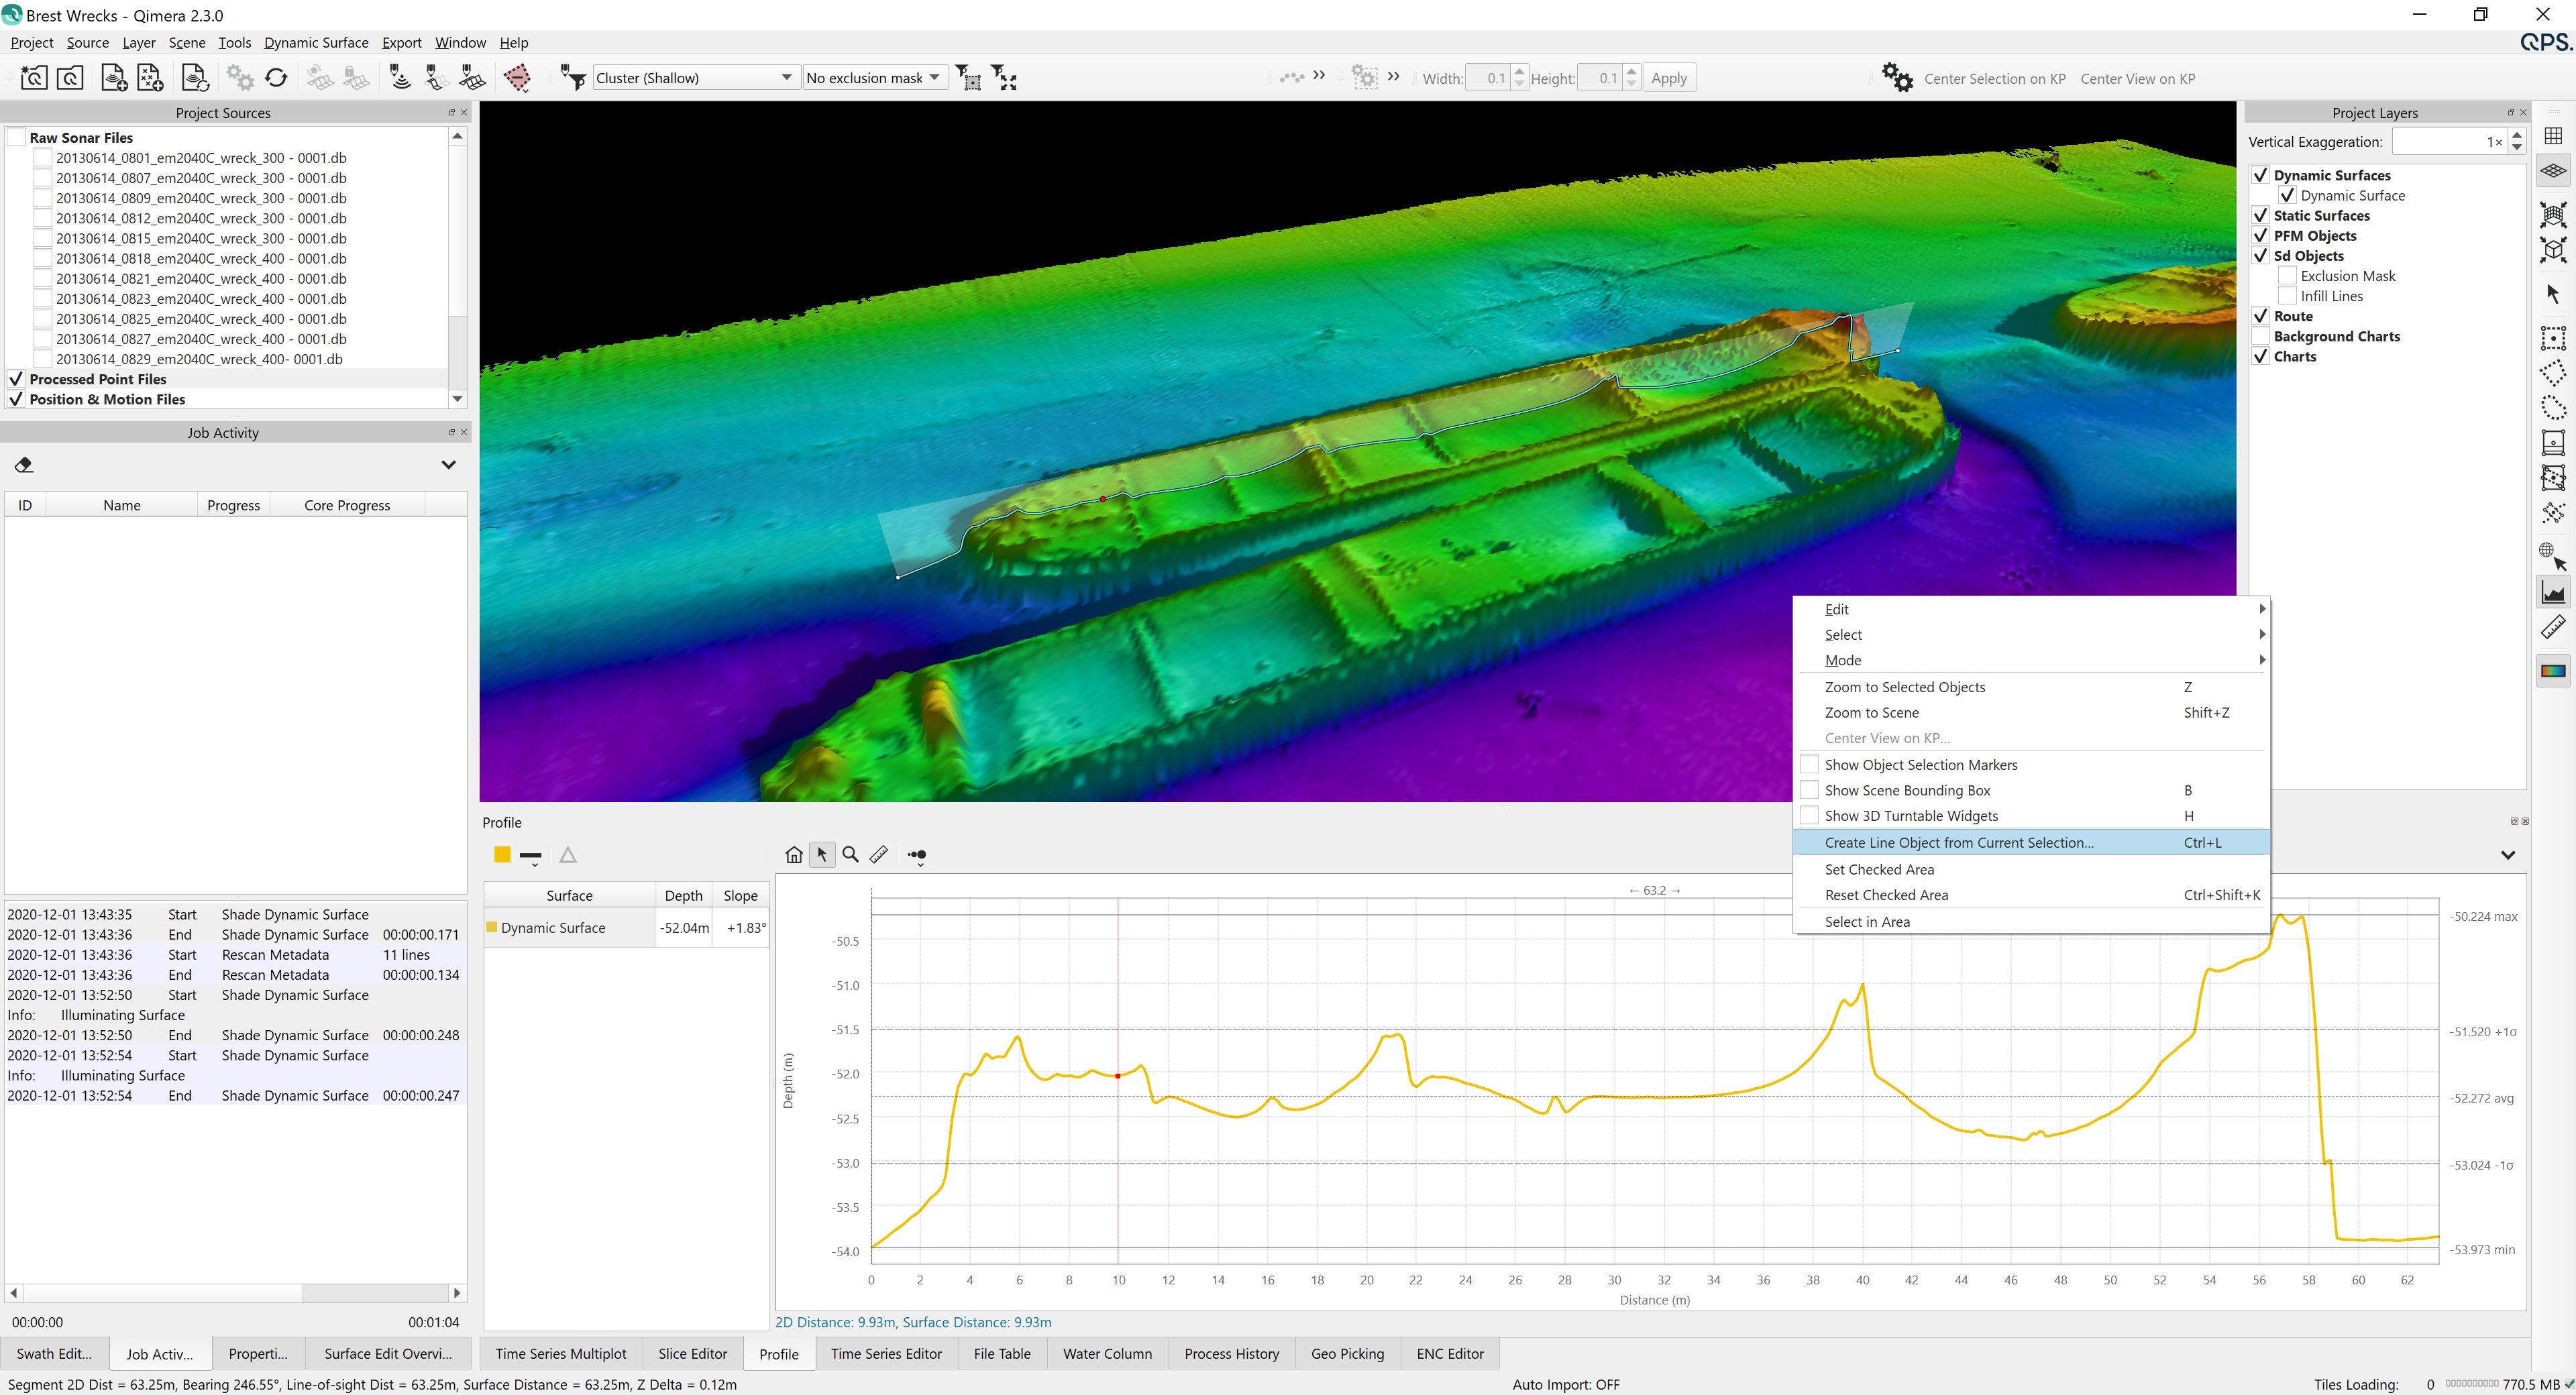
You then give the saved object a name. The resulting .sd file will appear in the Project Layers dock.
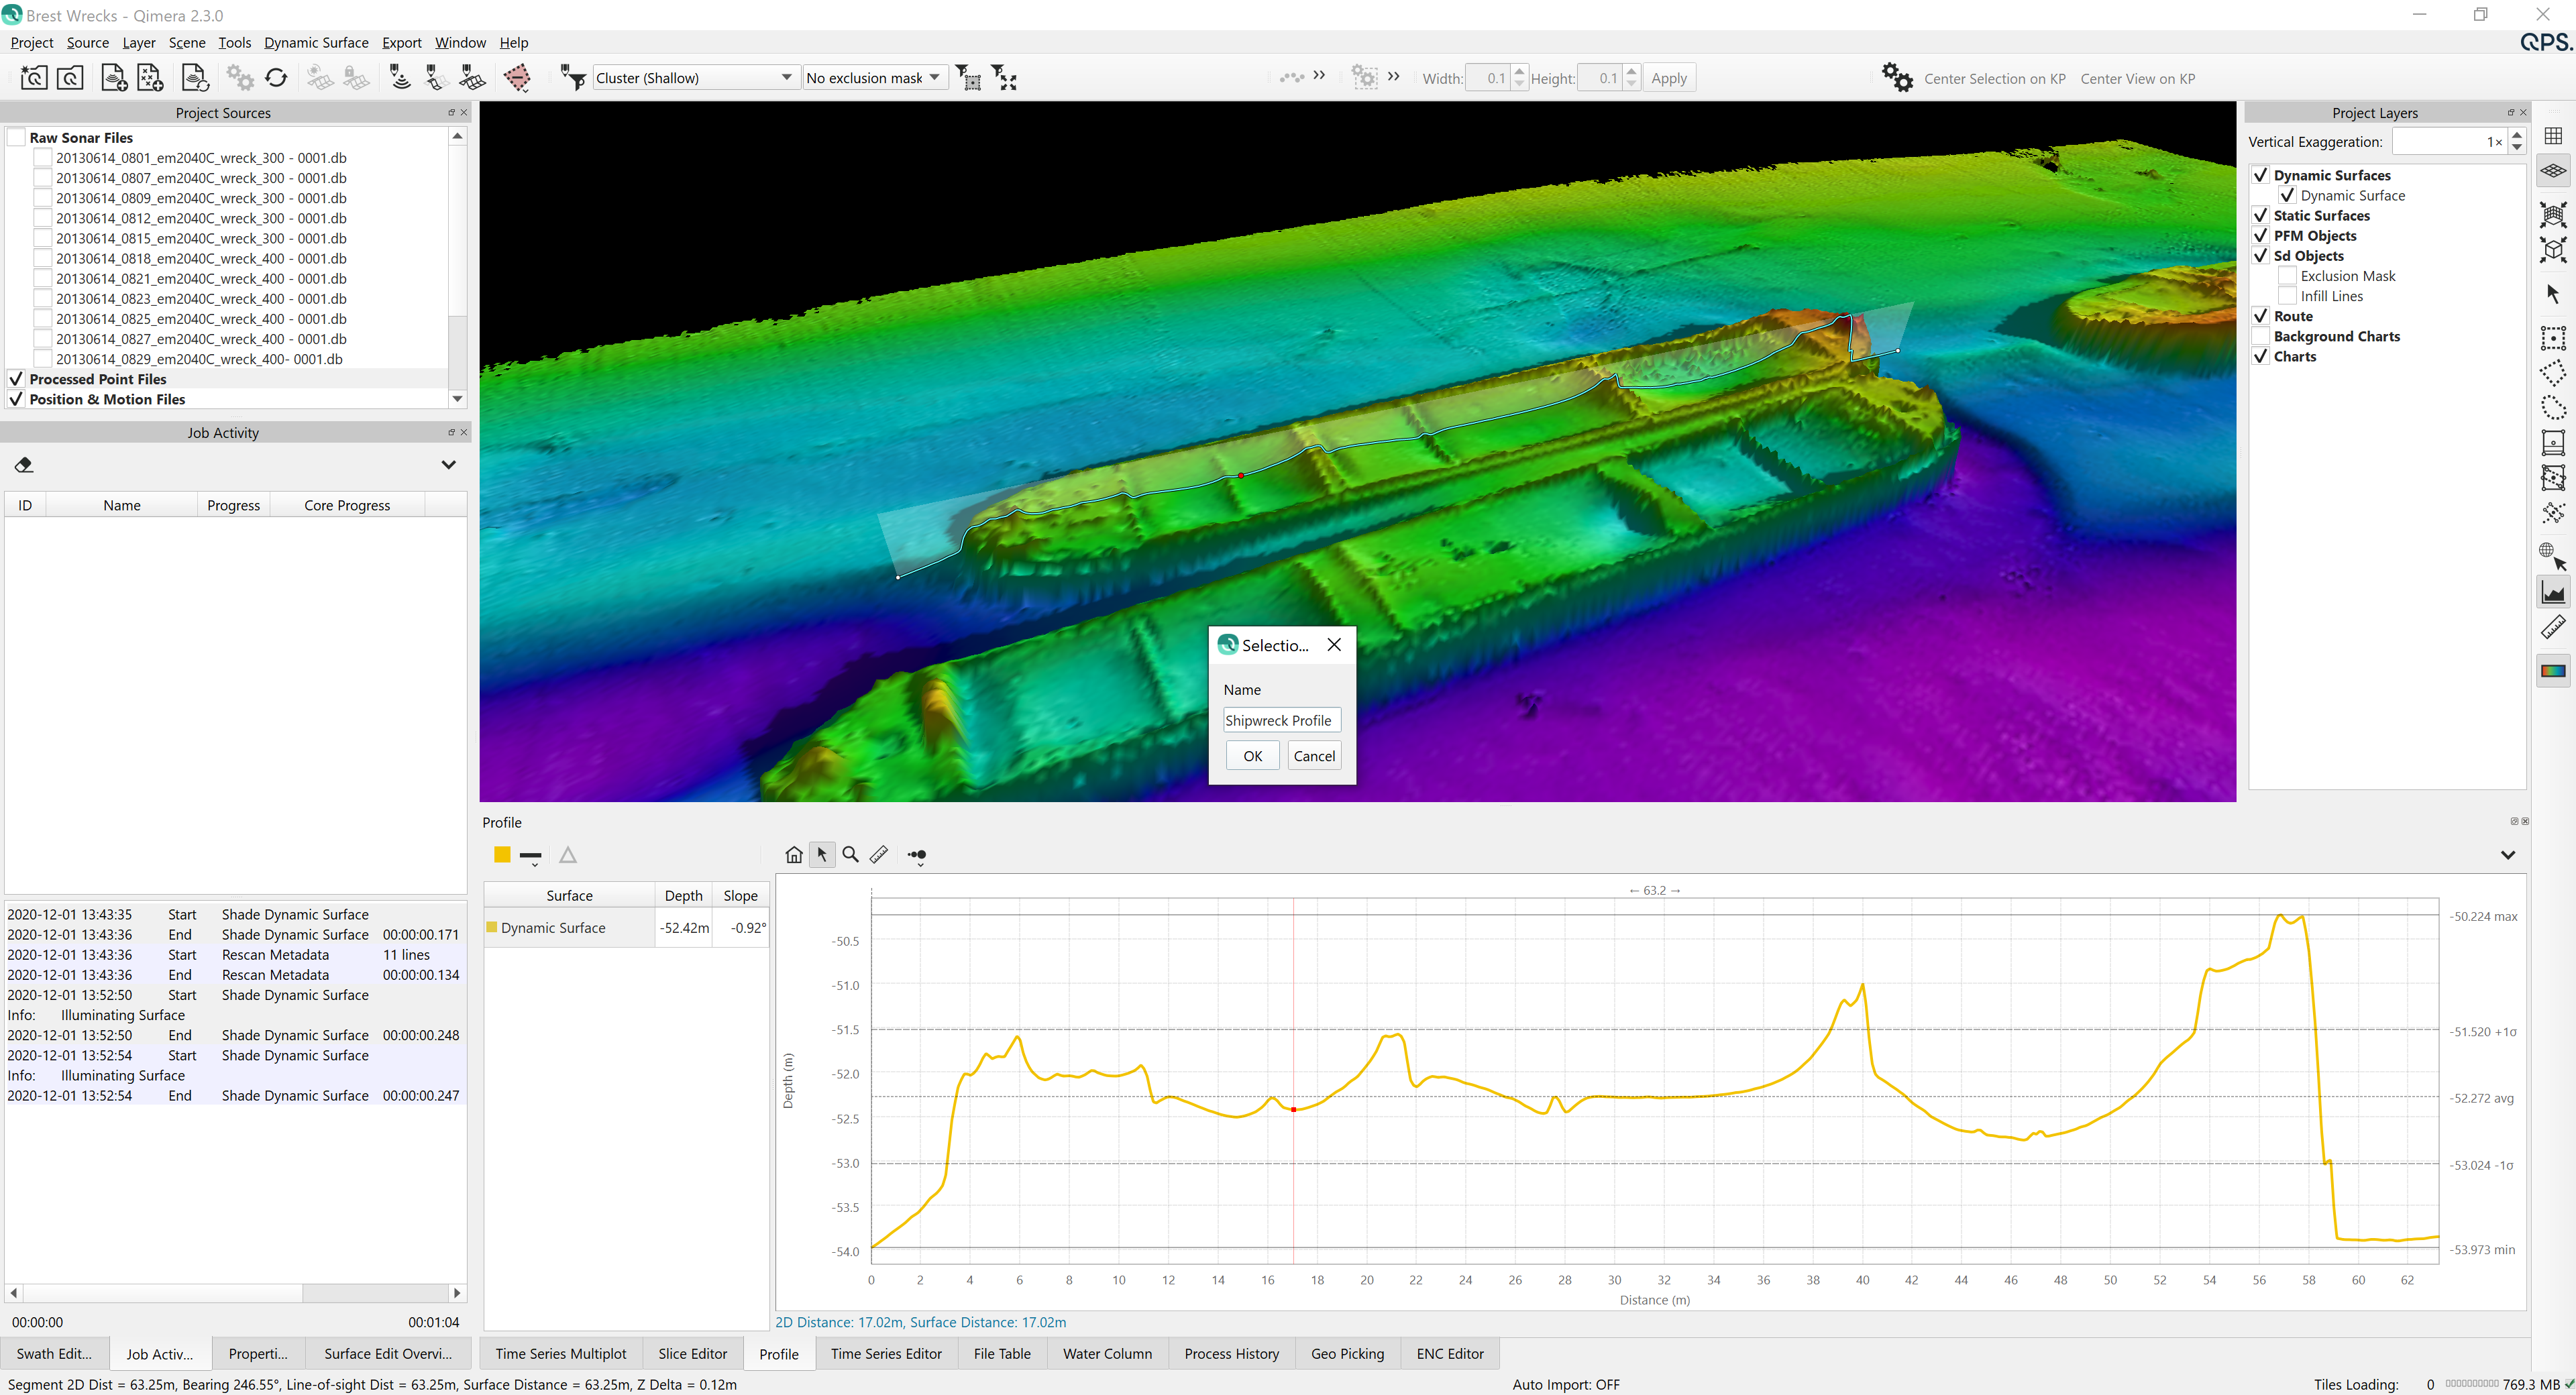
Later on, you can select the saved profile line in the Project Layers dock, right-click and use it to create a profile from that object.
The profile line is then used to sample the selected surfaces and the Profile dock is updated.
Project Sources
Project Sources now has new capabilities in the right-click context menu. You have much more flexibility when it comes to selecting, grouping and organizing your raw sonar files.
- Selecting Files now has all of the following options:
- Select All Files in the Same Vessel
- Select All Files with the Same Start Date
- Select All Files in the Same Folder
- Select All Missing Files
- Select All Files with Errors
- Select All Files that are Ready for Processing
- Select All Files that are Fully Processed
- Select All Empty Raw Sonar Files
- Creating Groups:
- We've copied Fledermaus 8's "Create Group from Selection", in the right-click context menu.
- You can use the enhanced Select options listed above and then create a custom group for these newly selected files using this option.
- Organize Files: You can now choose to Order by Start Time
CAD and ENC
- CAD has improved support for colors and labels. Since .sd objects can only contain one object type per file (e.g. points in one file, lines in another), a CAD file is "exploded" into a points and a lines .sd files. These are added under a single group with the group name coming from the DXF/DWG/QGF.
- Visibility can be controlled separately for points and lines as well using the normal mechanisms. Labels are stored as separate .sd objects, either individually or as a group, and thus their size can be adjusted as well to suit your display needs.
- ENC Administrator will now allow users to create an encryption key based on a softlock license to allow use of S-63 protected charts with softlock licenses.
- We've upgraded the global scale ENCs that install with Qimera, there is now full global coverage available and more detail for lakes and rivers in inland areas.
Miscellaneous
- Improved readability and layout of mouse cursor position info in lower status bar of the application.
- In the Vessel Editor, TPU settings for multibeam systems will warn if you configure unrealistic pulse lengths.
NOAA CSV export of trackline statistics how has units in the header fields of the .csv file.
Contouring now gives default file name inherited from the source surface, along with the contour interval. This helps you keep track of which contour files come from which surfaces when working with multiple surfaces and/or multiple contouring intervals.
- Geotiff import has had stability improvements in scenarios where several images are imported.
