Qimera 2.1.0 - Improvements
Dynamic Surfaces
Ability to create spot soundings
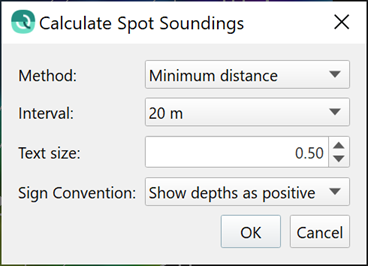
The ability to create spot soundings was a highly voted upon Feedback item. In order to accomplish this, we reused the technology from Qinsy's Survey Manager. The spot soundings are retrieved from the average depth layer and have a single .sd points file as output. The user can control the size and shape of these soundings as well as the marker type. The soundings are drawn in 3D at the correct z-level, so they will appear approximately at the surface z-level. To ensure the labels are drawn on top, the offset attribute (below the color map section) can be used to adjust the drawing height. The spot soundings will render as standard decimal numbers, as opposed to the fractional subscript used on nautical charts. The current visualization capabilities of the Fledermaus 7 engine cannot draw the fractional part as a smaller sub-script number. However, this will improve when the new Fledermaus 8 visualization engine is integrated, allowing for overall greater flexibility in the visualization of spot soundings and all other graphical elements.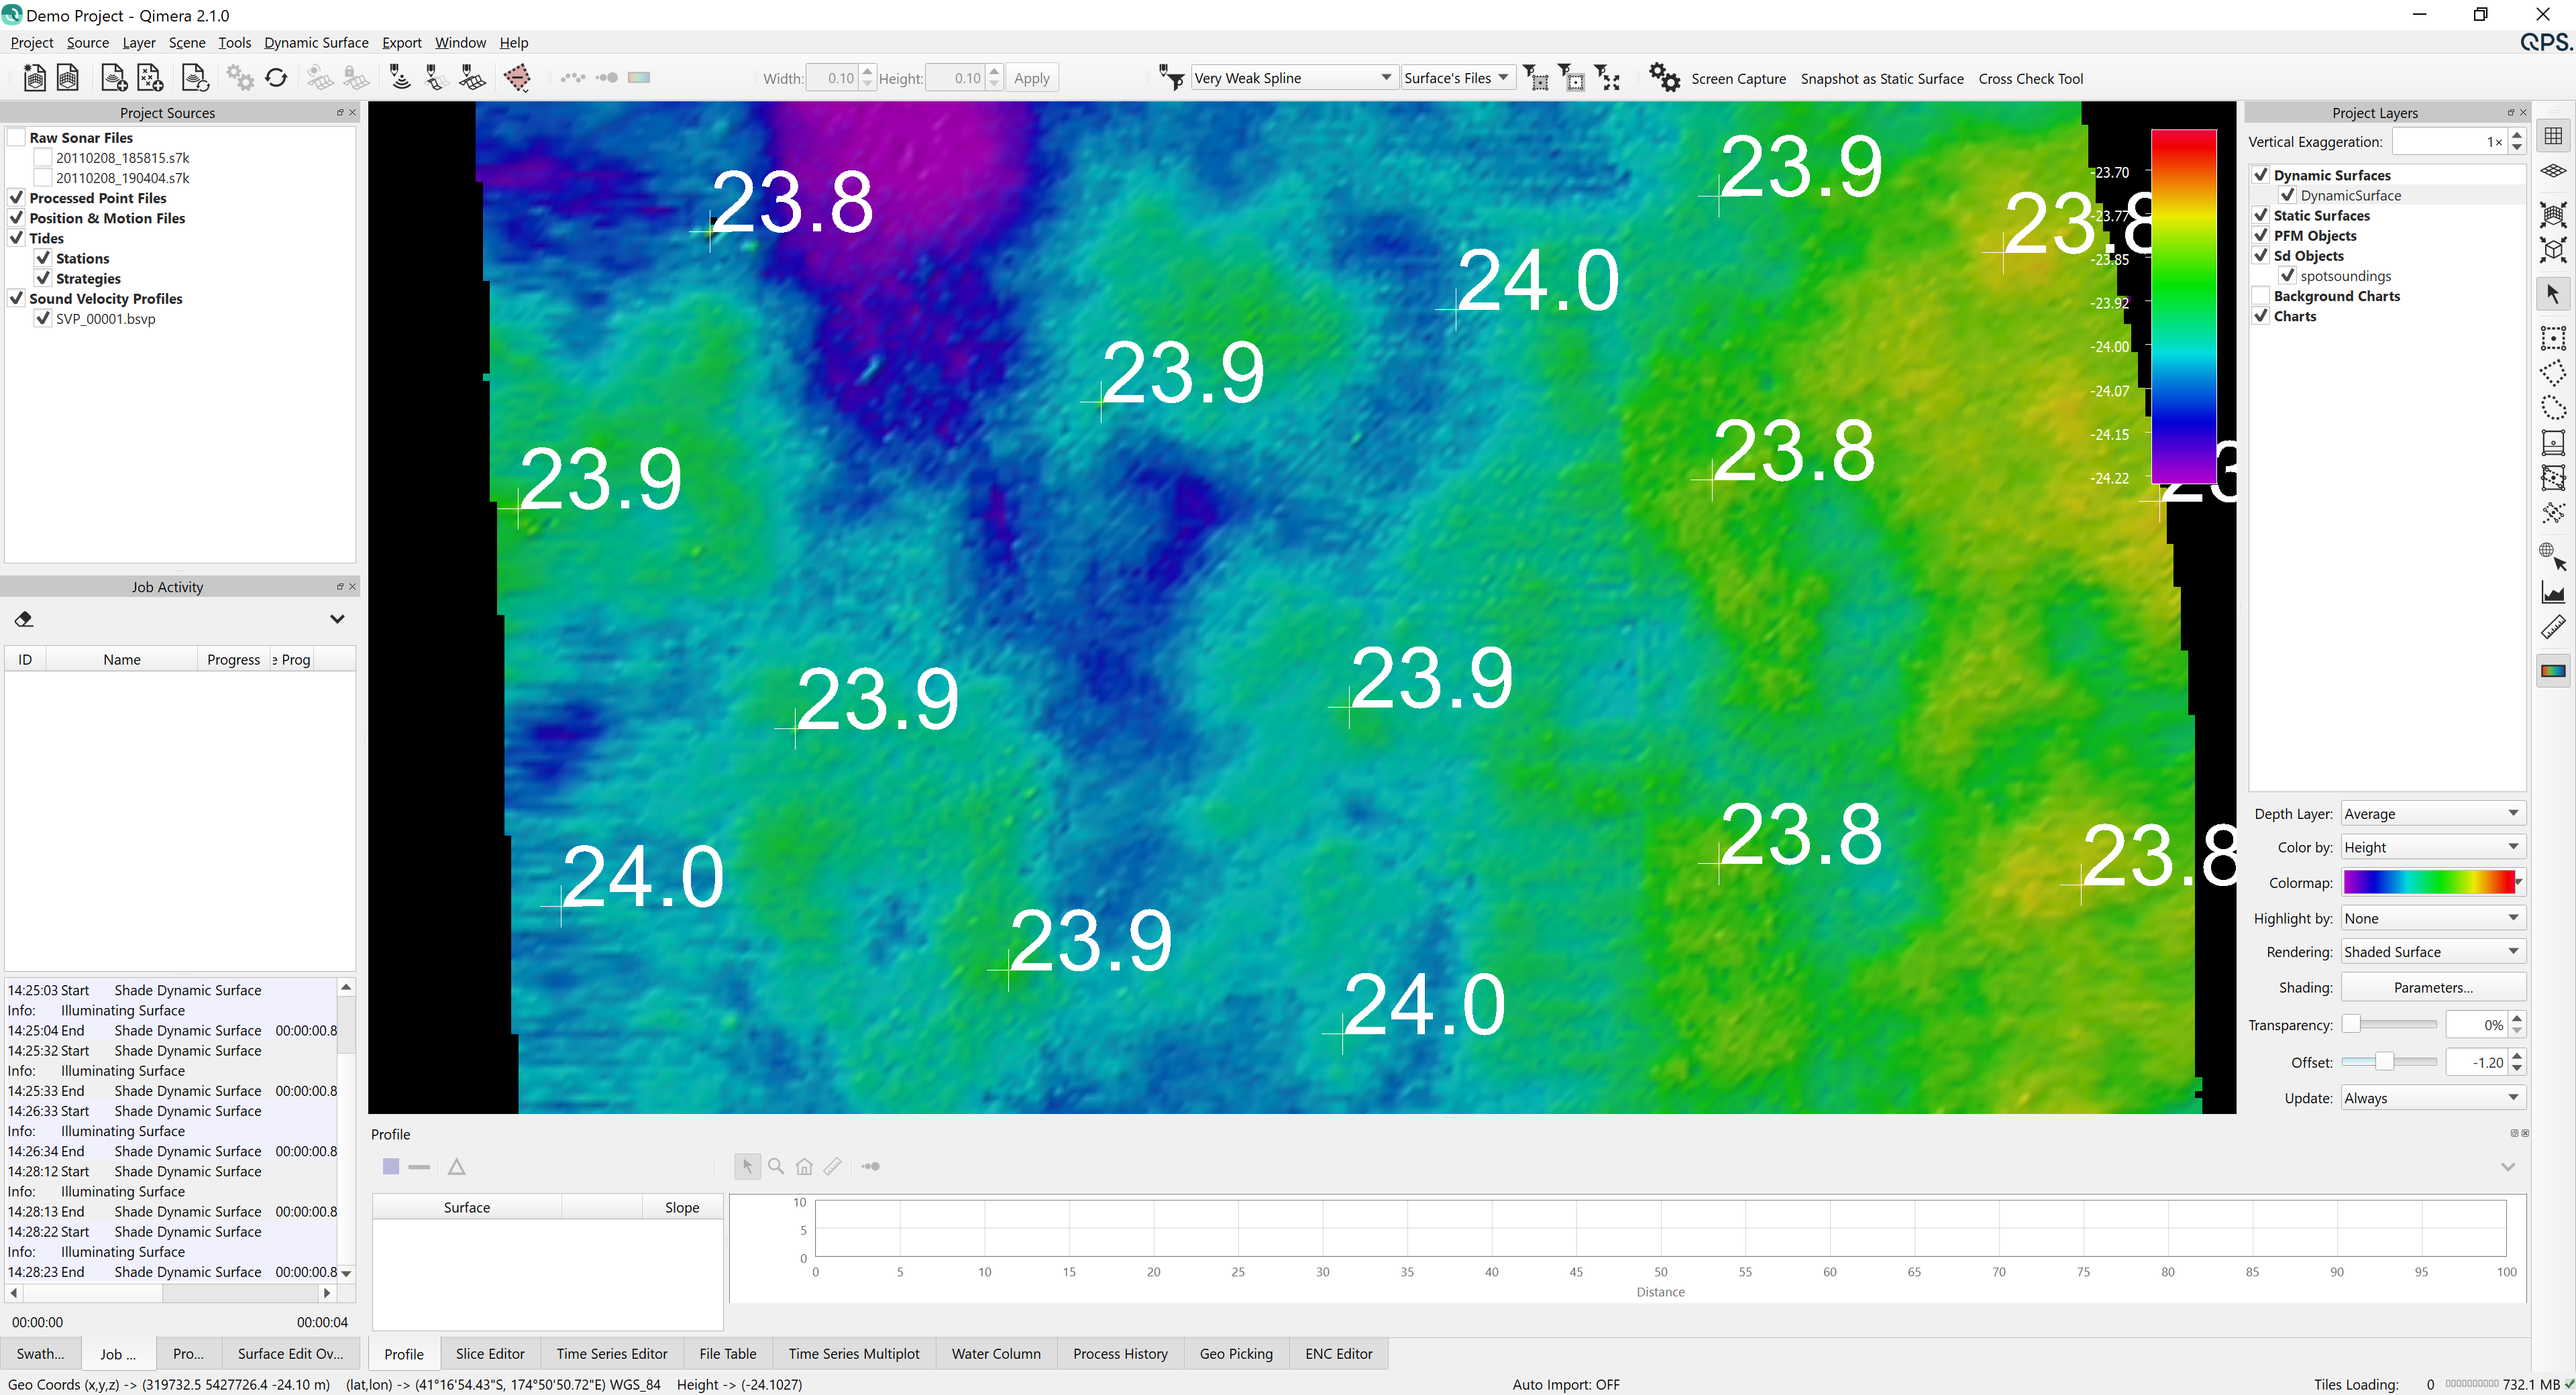
Ability to create THU and TVU surfaces
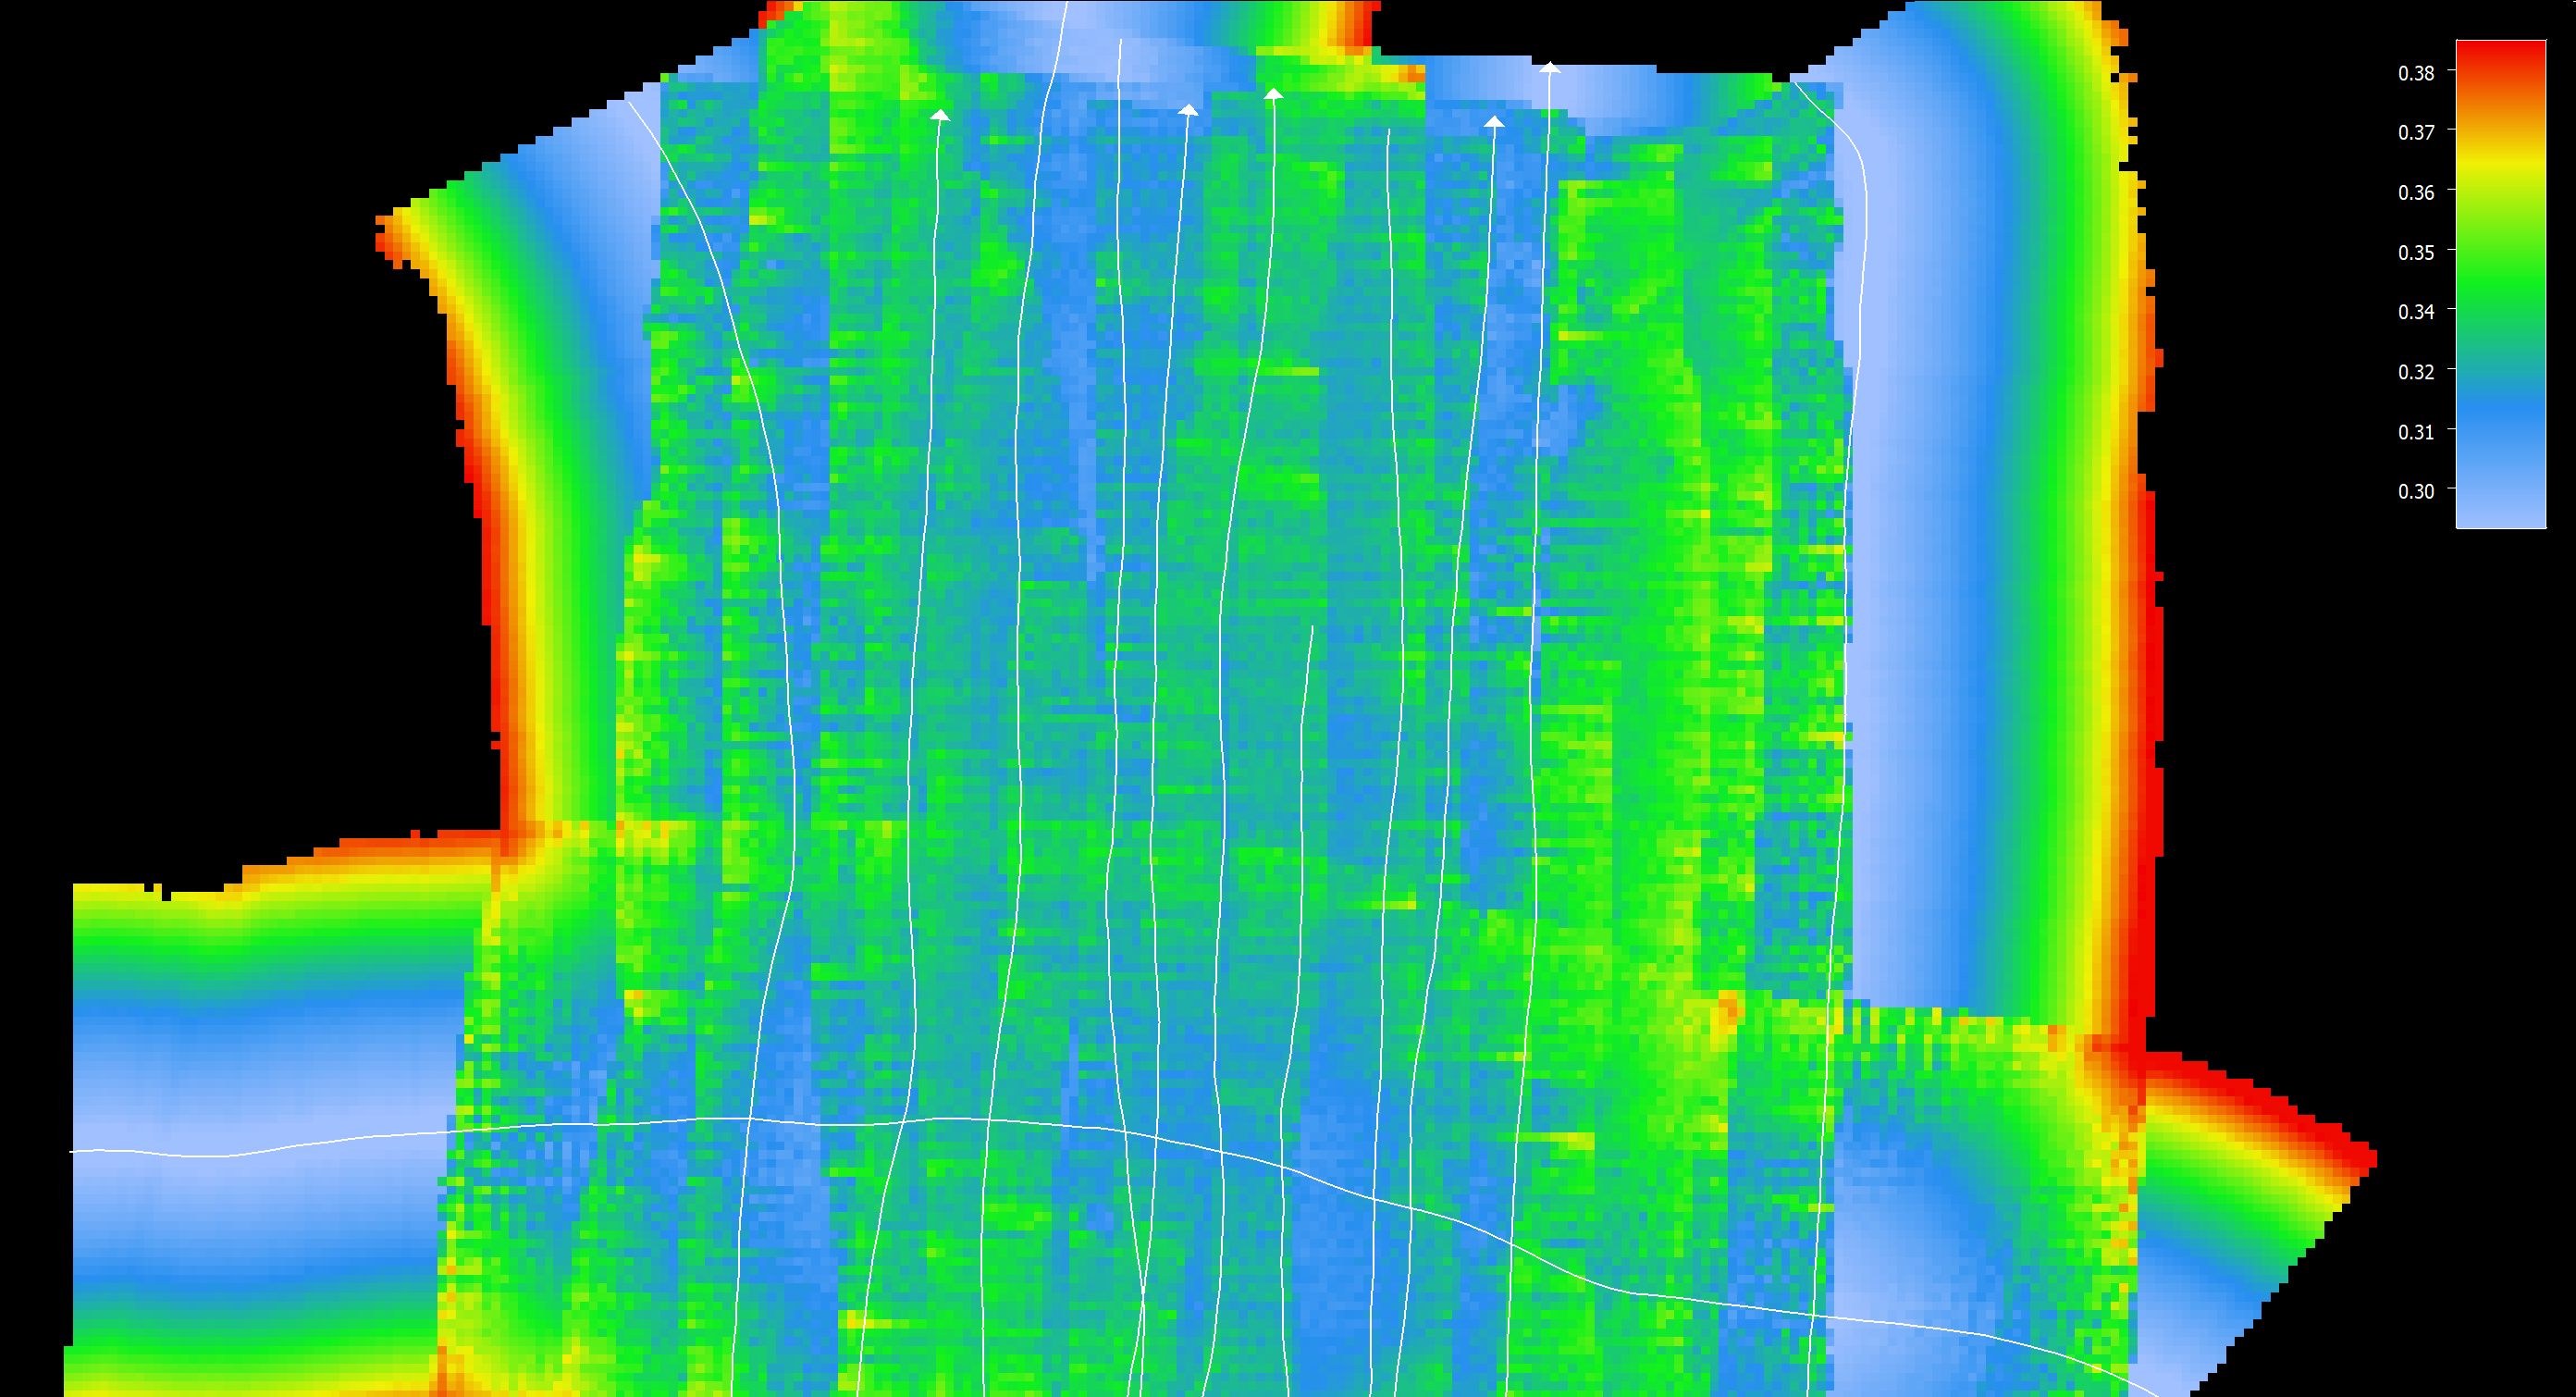
This new feature was another highly voted Feedback item. The user selects a Dynamic Surface and then runs the "Create THU and TVU layers" command under the Dynamic Surface menu. This creates two new layer files that hold the average horizontal and vertical uncertainties from the soundings in each bin. These are both saved as .sd files and they can be exported to a number of ASCII and interchange formats such as Geotiff, Floating point Geotiff, ArcView Grid, etc.
Remove lines from a Dynamic Surface
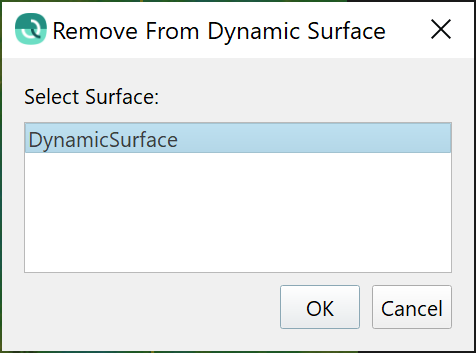
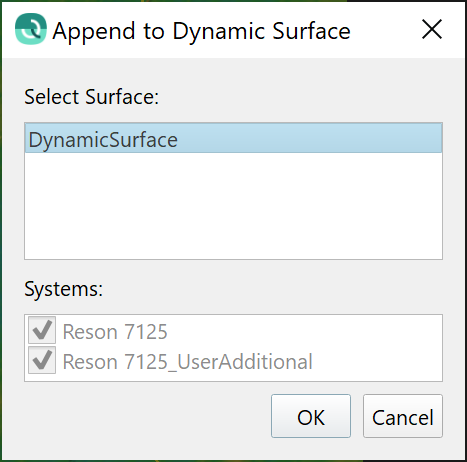
This dialog is now common for adding and removing lines from a Dynamic Surface. Select lines to be removed, right-click and choose "Remove from a Dynamic Surface". A dialog will launch that lists all Dynamic Surfaces that contain the lines selected for removal, then the user selects which surface to remove the lines from.
Interpolation algorithm, new option to interpolate with a fixed value
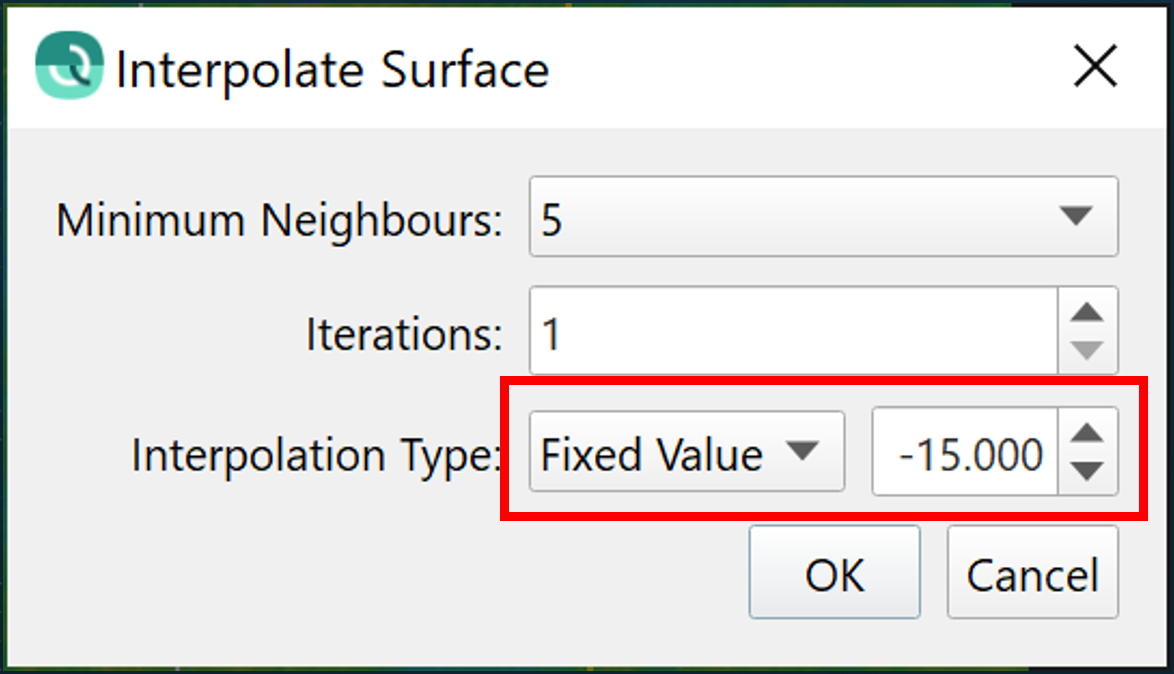
This comes from pre-existing Fledermaus workflows, where users sometimes need to populate empty cells with a design height or a contractually specified null value. Because this is a shared dialog between Fledermaus and Qimera, this option is now available in Qimera as well. The default option remains to fill empty cells with an average.
Point Editors and Filtering
New "Color by fixed color" mode
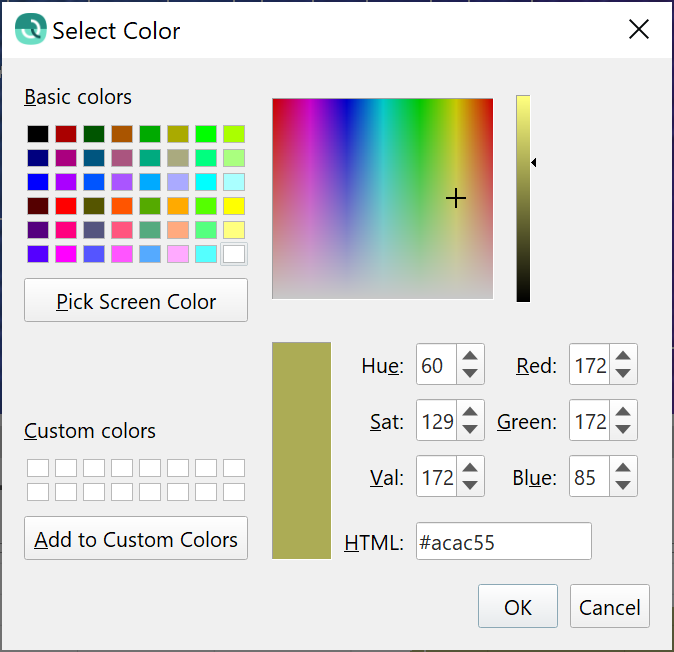
This feature allows users to pick a single color to use for coloring points in the Swath Editor, Slice Editor and 3D Slice Editor. When this option is selected, the usual color map picker dialog is replaced by a color picker dialog. Note that this option existed already in the standalone 3D Editor, this is yet another improvement that brings these two editing tools closer into alignment.

Instant Surface Filtering
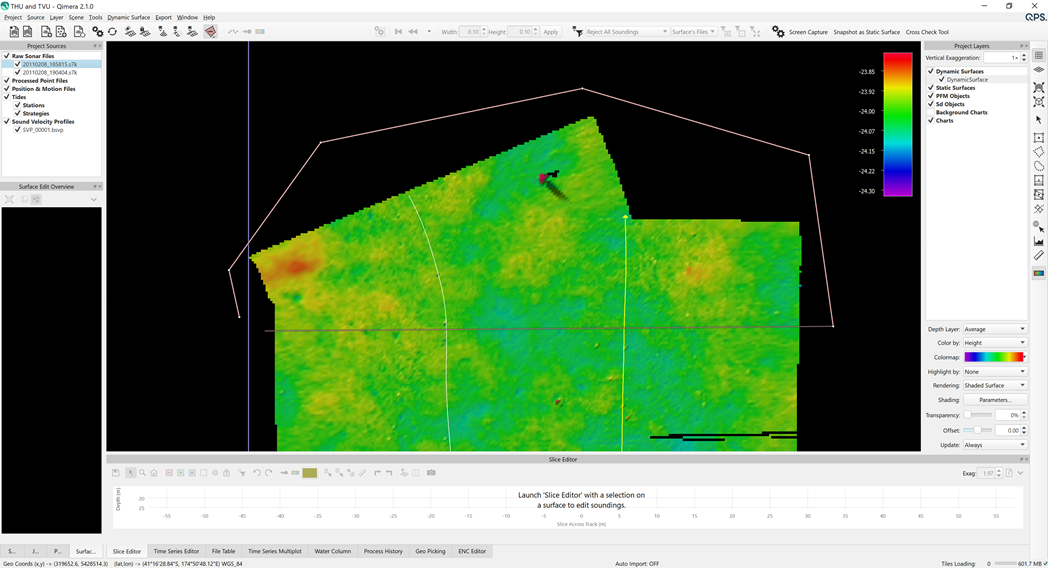
Instant Surface filtering has been improved to indicate the operation mode more clearly to the user, in order to reduce the likelihood of accidentally deleting data with grid operations. The polygon that is drawn is now color coded, has a thicker line and covers all three Instant Surface Edit modes: Instant Surface Reject, Instant Surface Accept and Instant Surface Filter.
New Filters
There are a number of new filters added to the filter tool set that is available from the filter toolbar.
- Filter by Uncertainty
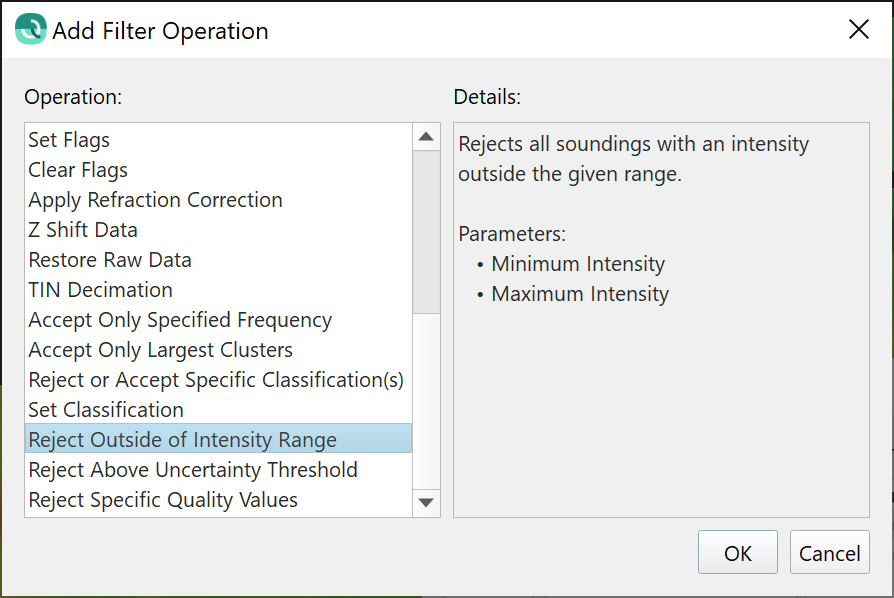
- Filter by Intensity
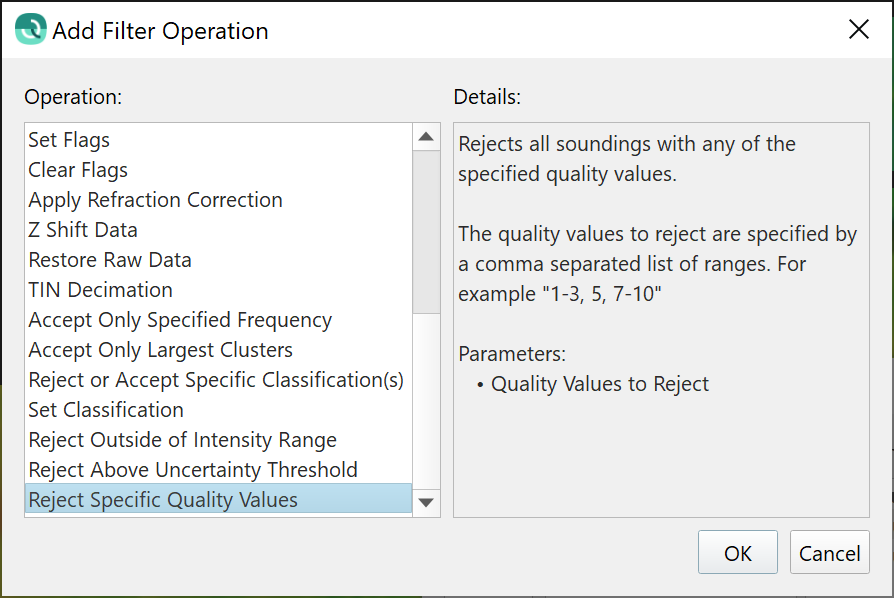
- Filter by Quality
These filters offer generally the same capability that's in Blocking, however with the filter toolbar it allows the user take advantage of the spatial selection capabilities to carefully select areas that they'd like to filter.
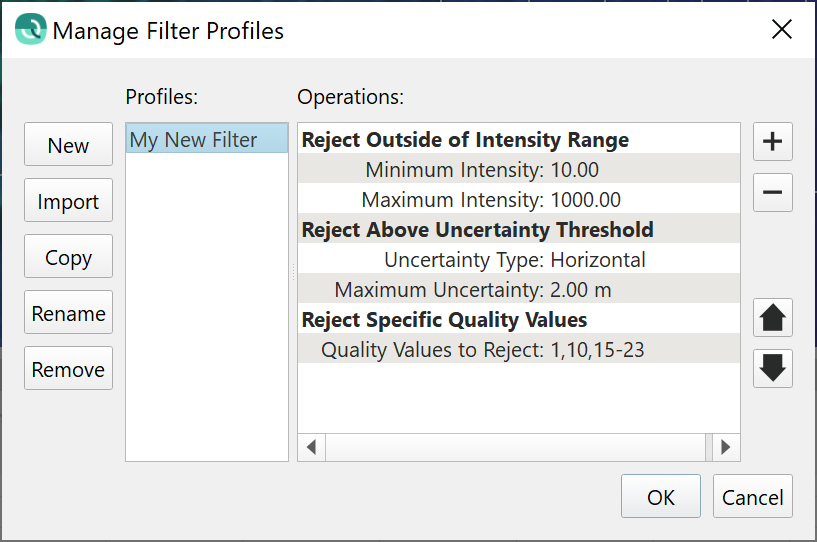
Recall that you can use the filter toolbar to create a custom filter profile that lets you combine many filters, as shown below:

Filter by Uncertainty
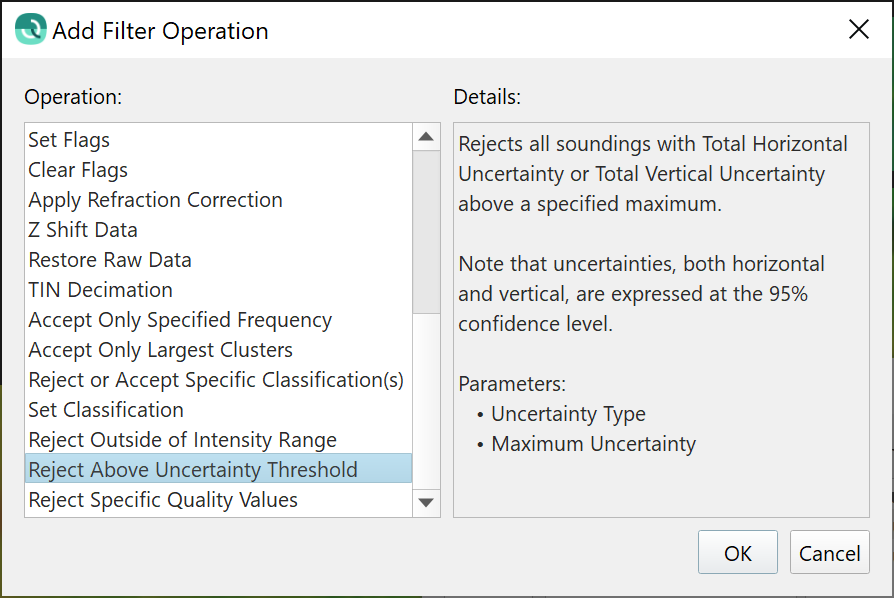
For the Uncertainty filter, the user chooses to filter by horizontal or vertical total propagated uncertainty (TPU). If you need to filter by both, then create one filter for each.
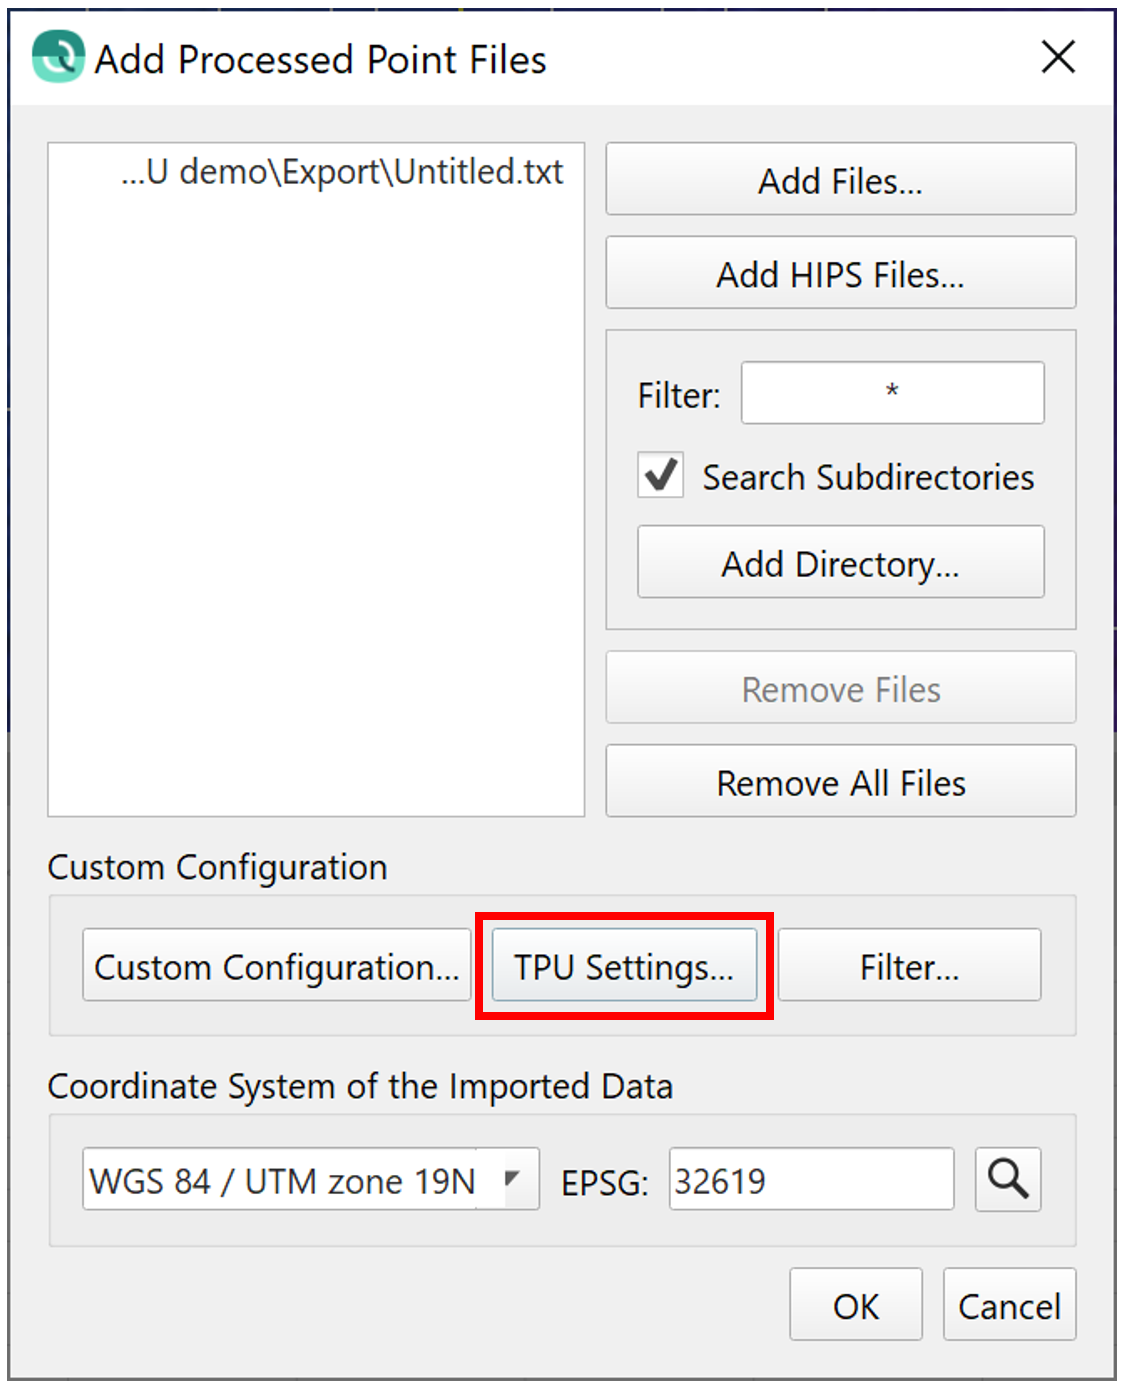
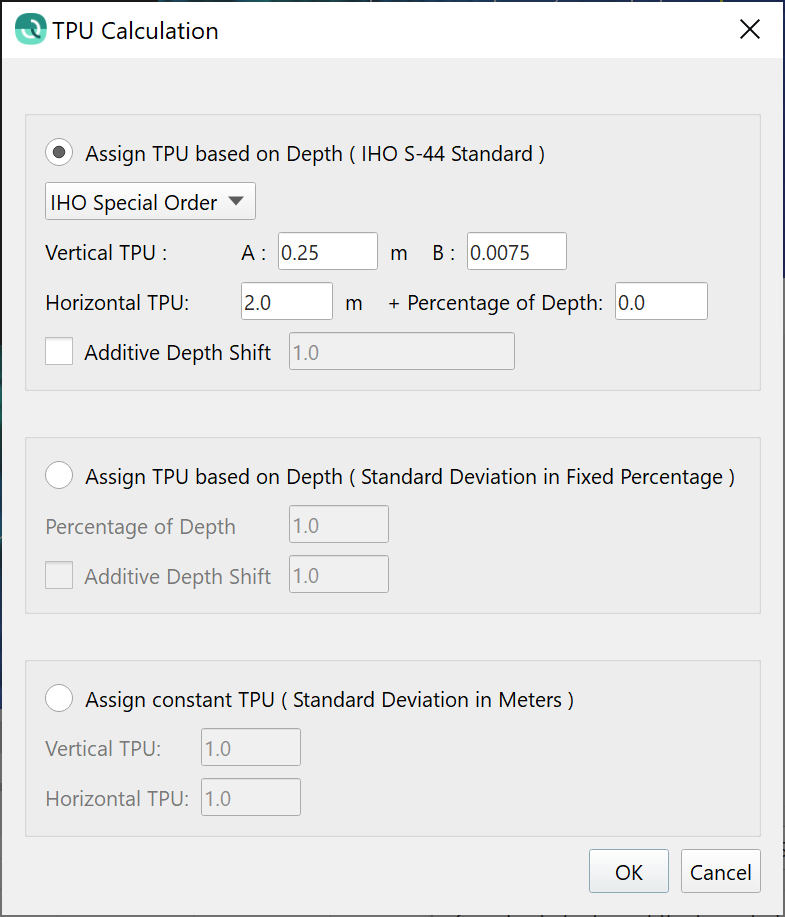
Note that users who have incoming ASCII point formats that do not have TPU available should use the TPU filter with caution; often ASCII XYZ data does not have TPU. The TPU can be estimated during import of the files by clicking the TPU Settings button on the import dialog, as shown below.
Filter by Intensity
You can now filter by intensity value, this is typically used with laser scanning or bathymetric LIDAR to remove very low intensity returns, for example. Note that users who have incoming point formats that do not contain intensity should not use this filter.
Filter by Quality
This filter lets you filter by a range of quality values.
The ease and capability of this workflow from Fledermaus PFM workflows has now been brought to Qimera. The pre-existing blocking Filters only let you specify a range to keep, this filter is notably different from the other two new filters in that it lets you specify one or more ranges to REJECT, which allows for more selectivity.
The quality values are reported in units that vary from one sonar manufacturer to another, so it is best to consult the manual for your sonar system to learn more about what filter values to use.
3D Editor Usability Improvement
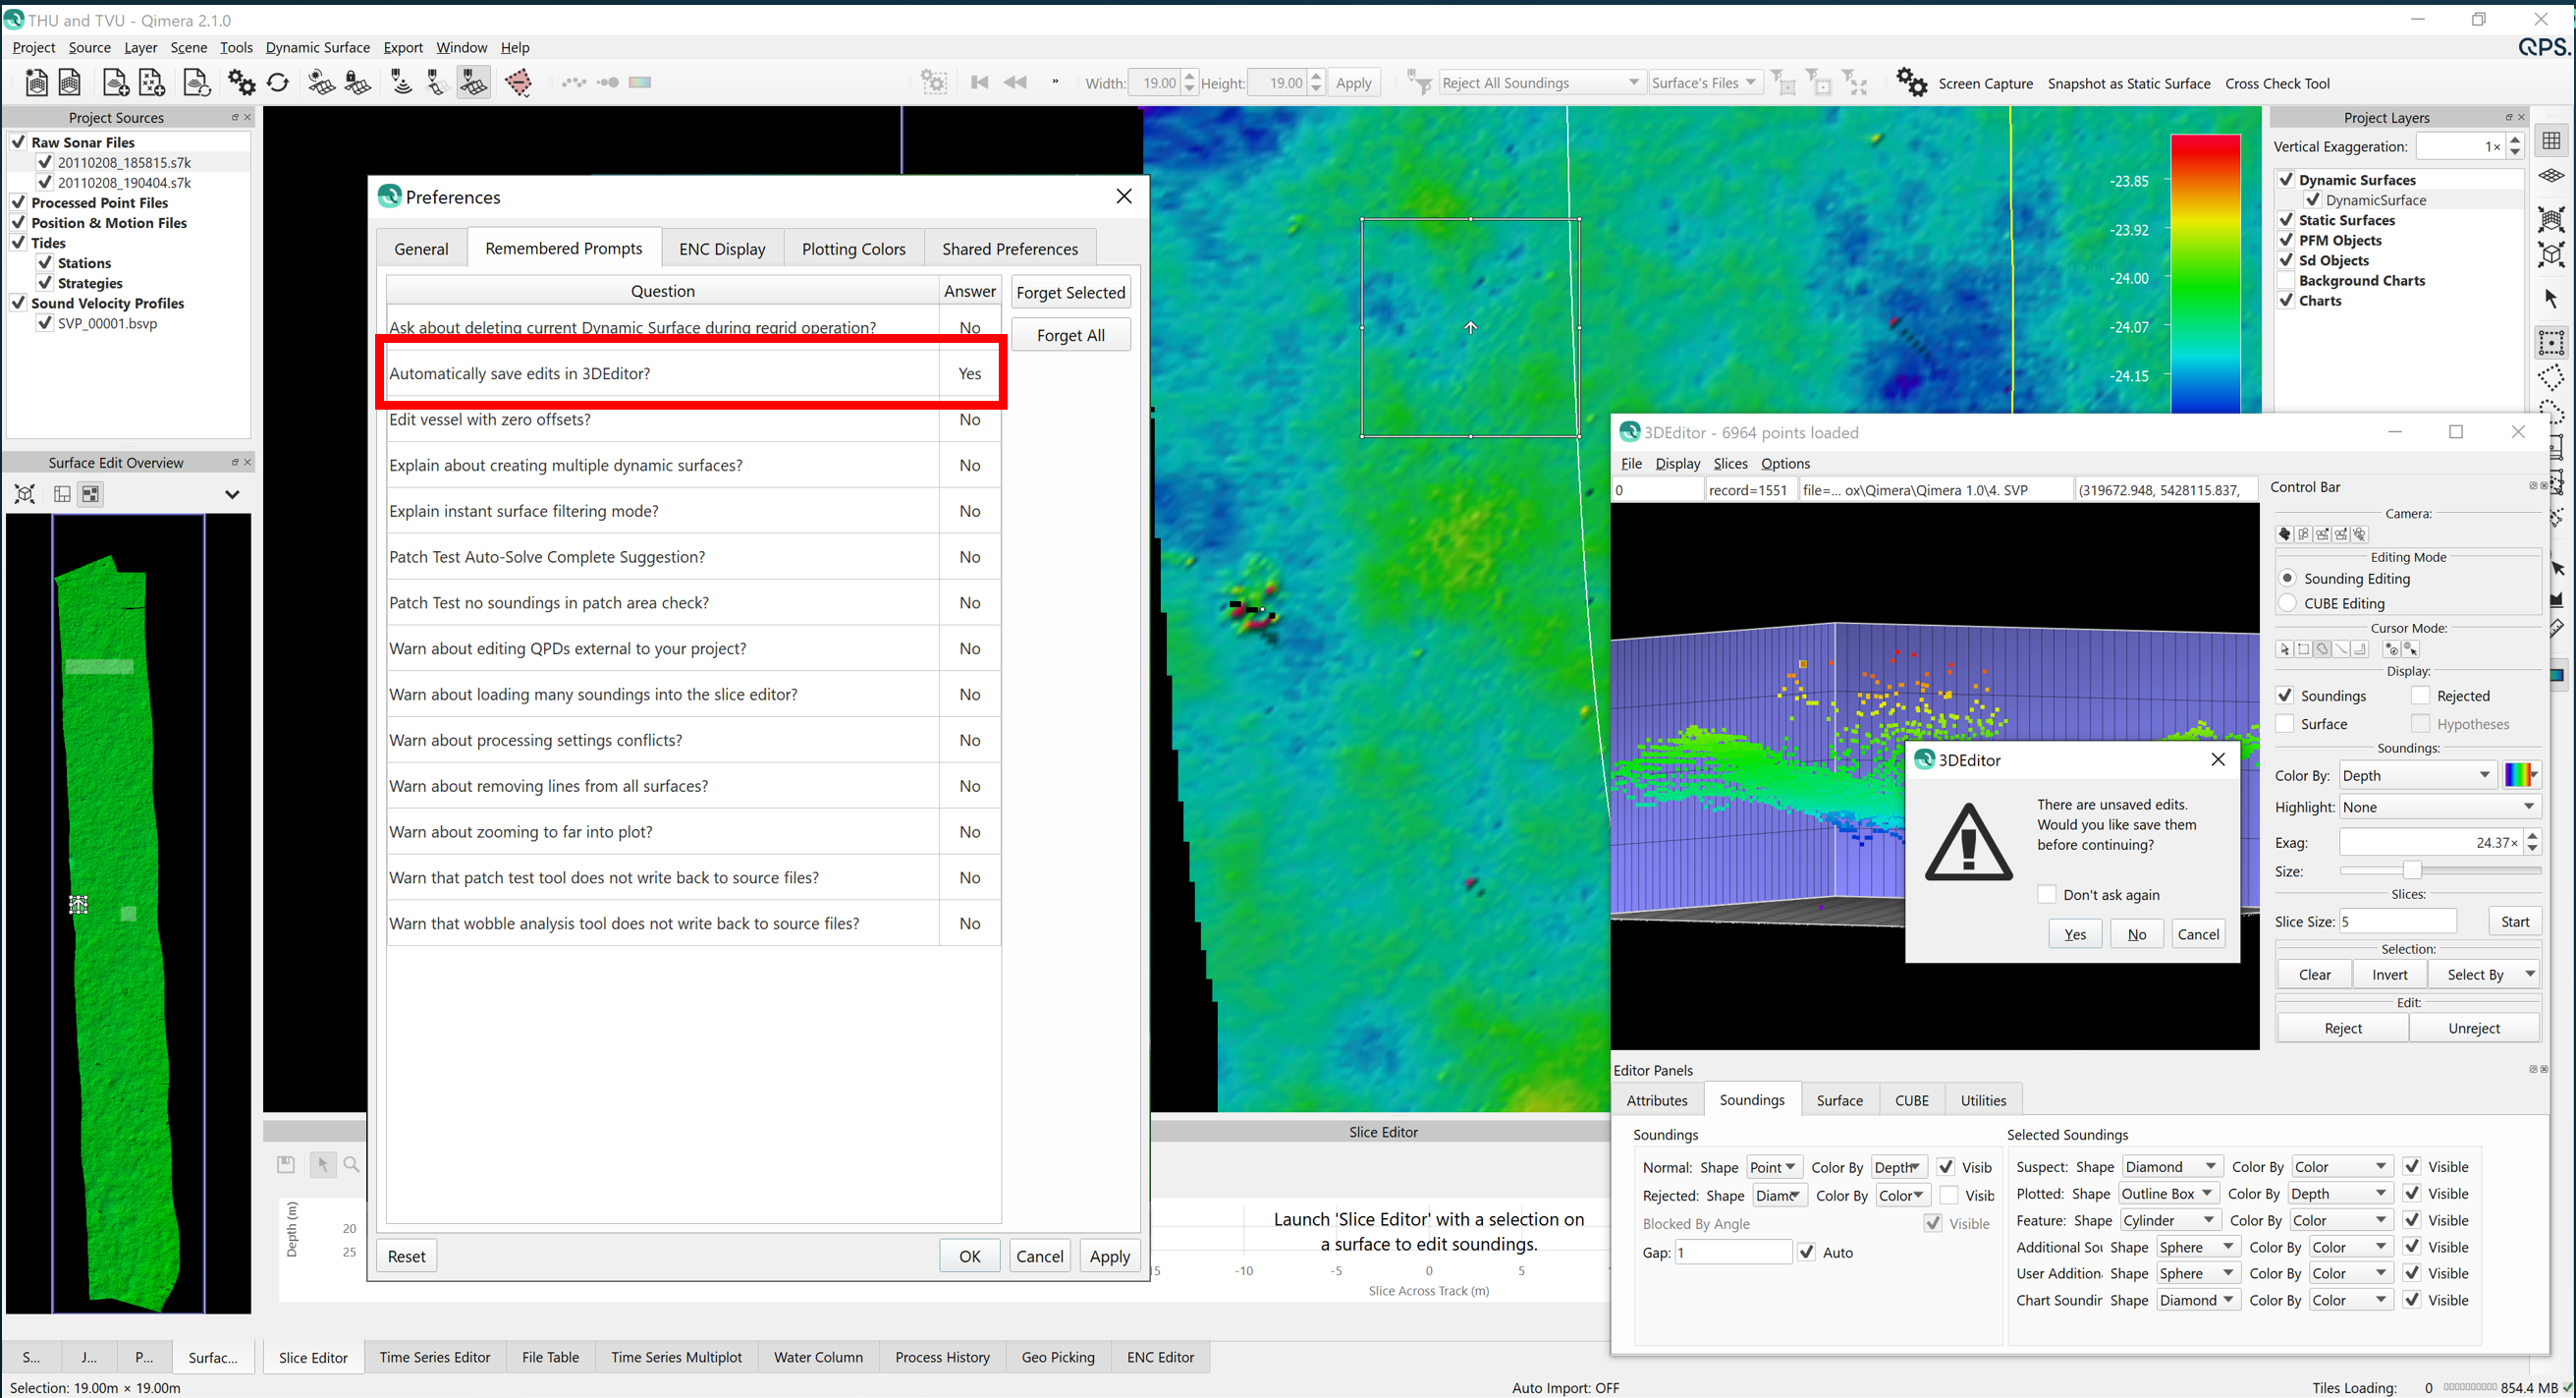
The traditional standalone 3D Editor now has a "Don't Ask Again" prompt added to the dialog that warns about unsaved edits when moving the selection box in the Scene. The decision you make the first time you are presented with this will be remembered. Most users will want it to automatically save the edits, so tick the box and choose Yes. This functionality brings the 3D Editor more into alignment with the user experience of the Slice Editor.
Processing and Analysis
SVP Editor
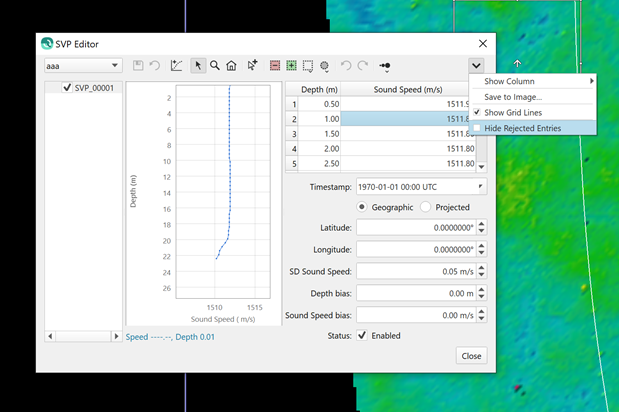
In another example of a quick win from our Feedback System, you can use the Delete key to delete rows in the tabular data of SVP entries in the SVP Editor. This is also available as a right-click context menu option when clicking on row entries.
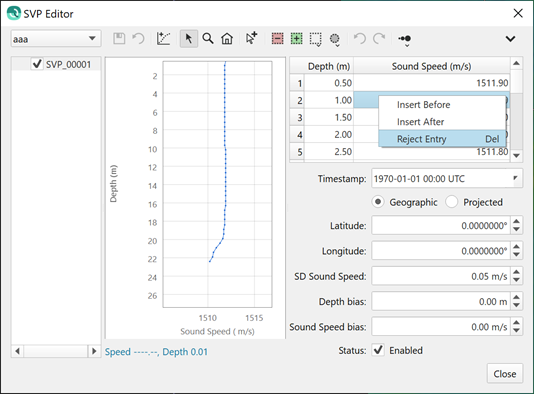
With the new row deleting capability, it makes sense that some users will want to hide the deleted entries. This can be done with a new view option in the context menu, see below.
Vessel Editor
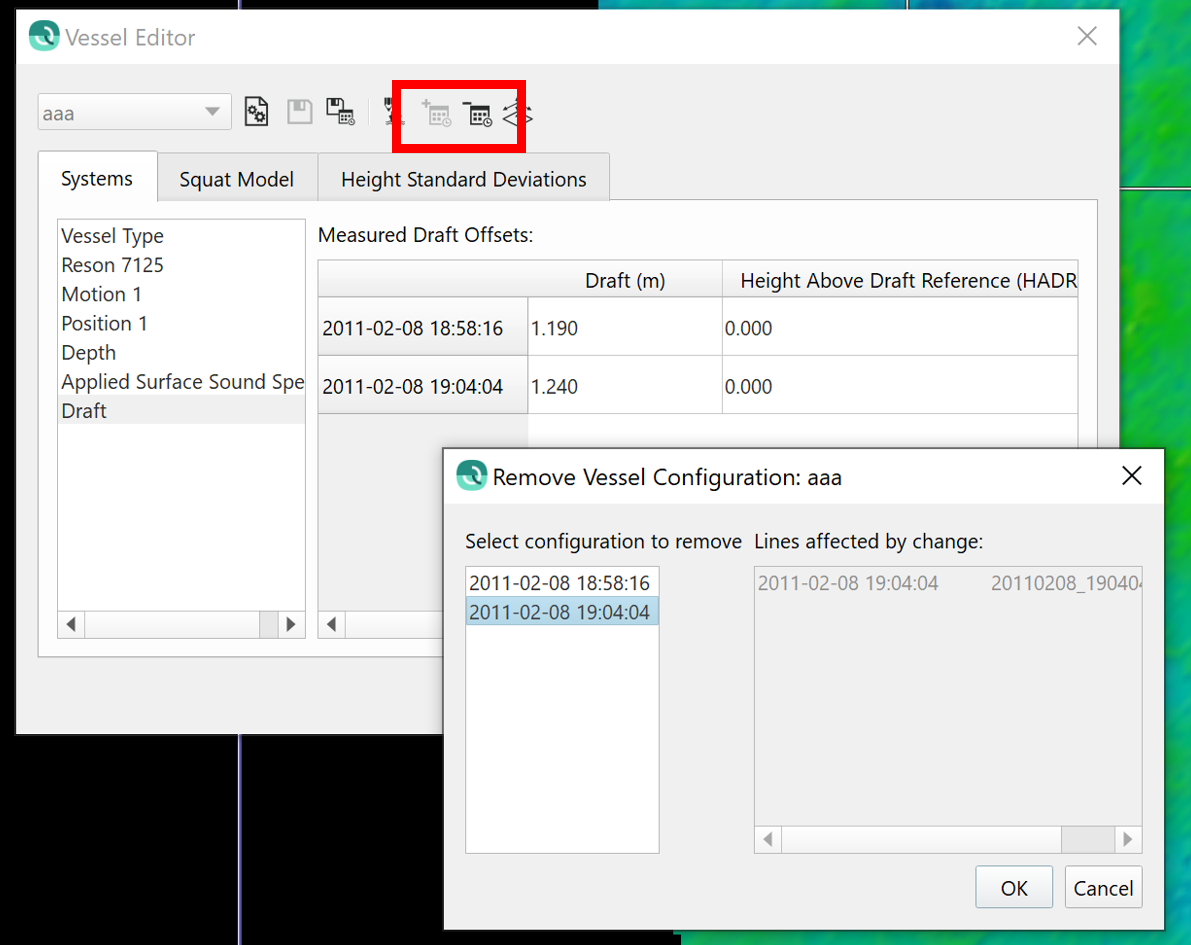
The Vessel Editor will now allow you to remove a date/time entry. Before, it was only possible to add an entry. When deleting an entry, a list of the current configurations is presented to the user for them to choose from.
When deleting the first entry in time, the next entry in time will take precedence. When deleting the last entry or a middle time entry, the previous valid configuration will take over.
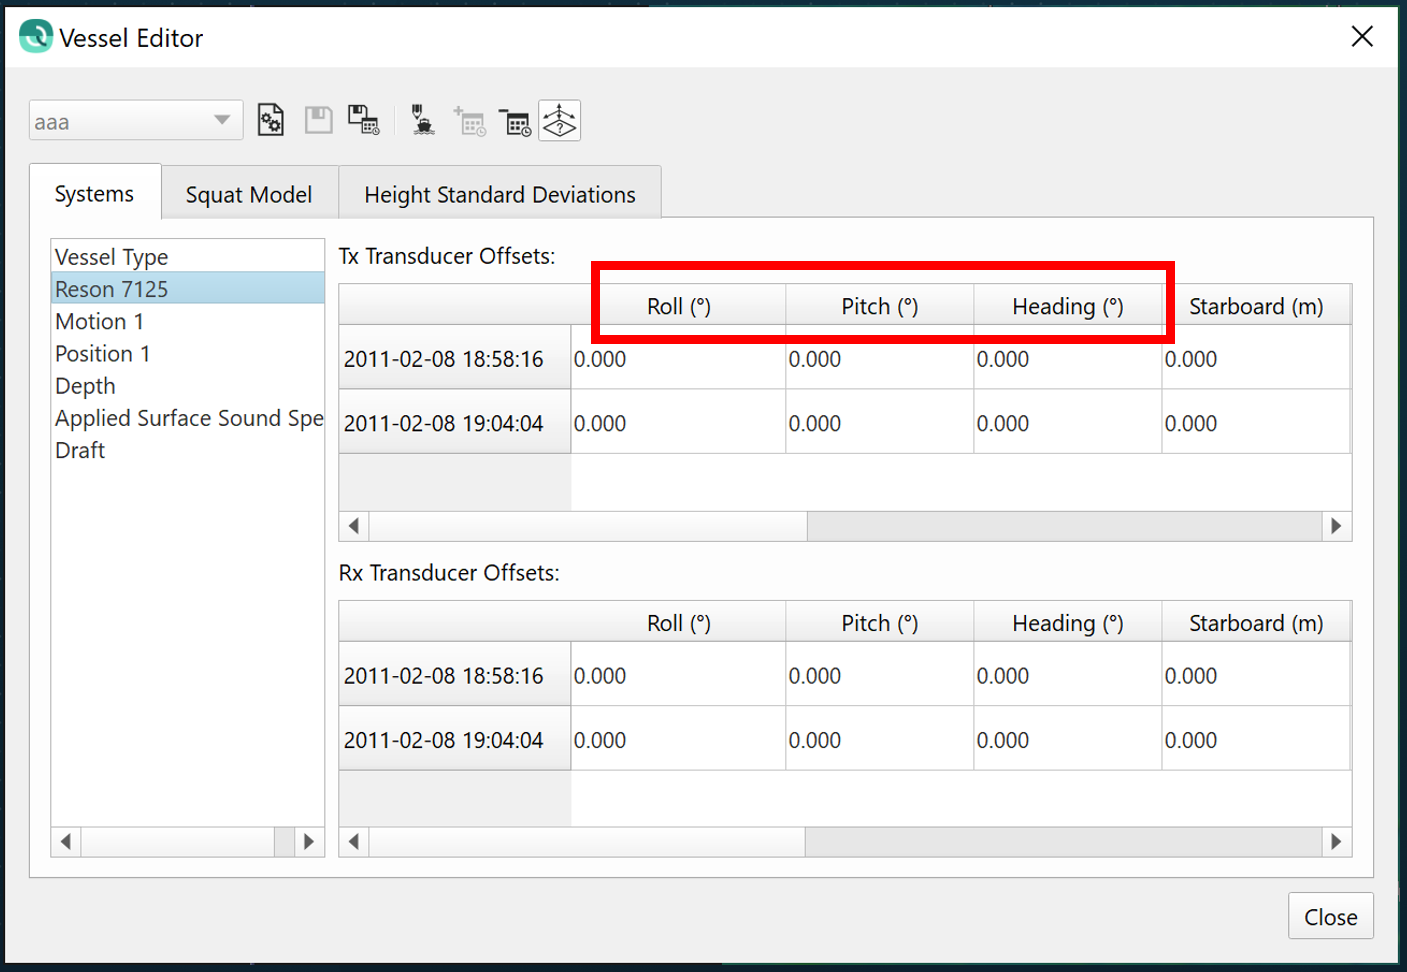
The column ordering for angular offsets for MBE/MRU systems has been changed to roll/pitch/heading. Previously this was ordered as pitch/roll/heading. This previously on occasion caused human errors when manually transcribing patch test results from one project to another, or one application to another.
Cross Check
We've upgraded the Cross Check tool to allow survey order selection for several different survey specifications used by our global clients:
- Netherlands
- NL Norm A
- NL Norm B
- New Zealand and Australia
- LINZ Special Order
- LINZ Order 1
- LINZ Order 2
- LINZ Order 3
These are now available from the combo box that controls how which survey specification the statistical results are compared against for a pass/fail assessment.
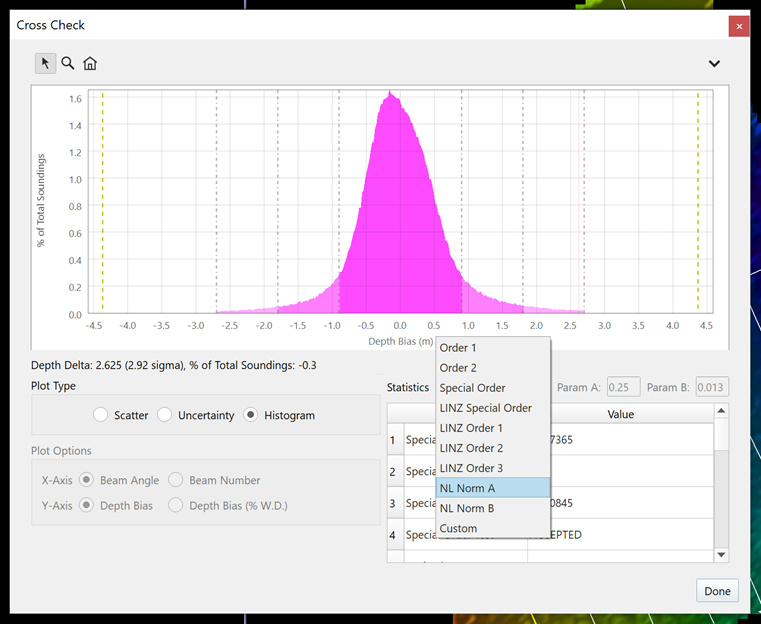
In terms of assessing pass/fail of a data set against a standard, we have changed the ordering of the tabular statistics output in this tool to emphasize the pass/fail of the test in the upper 4 table rows. We did this because pass/fail results are among the most important pieces of information in the table. Previously, this information was written at the very bottom of the list, requiring the user to scroll down to see it. This reordering of the statistical results is also done in the ASCII text export and in the report.
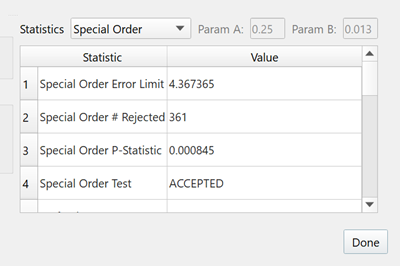
We have fixed and updated the histogram to clip the outliers on the low end of the histogram. The histogram was not clipping them previously, which typically resulted in in the lowest bin containing a spike. We have also changed the color ordering in the histogram plot so the colors become more transparent as uncertainty increases. Now, the center of the histogram is dark and the tails of the histogram grow lighter with higher levels of uncertainty.
Improvement to Structure from Motion Bathymetry add-on
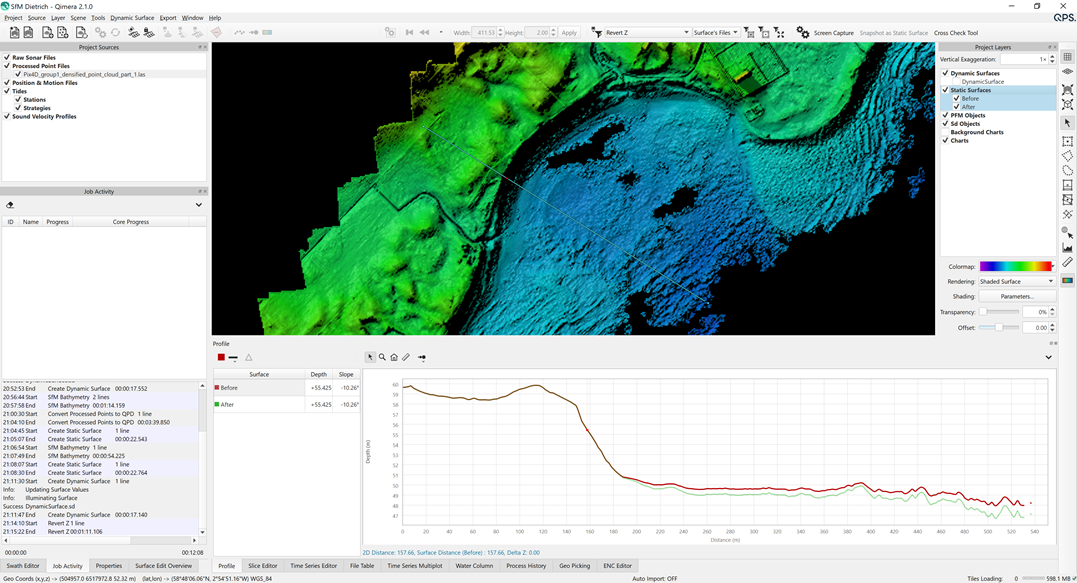
We have added a new computation method that takes into account camera positions and orientation to estimate view geometry for each photo, which is used to determine the incidence angle for a given pixel. The previous method could not account for the incidence angle, thus sometimes users would have to use an unrealistic refraction coefficient to force the resulting values to match against known bathymetry. This new method, based on the work of Dietrich, overcomes this previous limitation (reference: Dietrich JT. 2017. Bathymetric Structure-from-Motion: extracting shallow stream bathymetry from multi-view stereo photogrammetry. Earth Surface Processes and Landforms 42 : 355–364. DOI: 10.1002/esp.4060.). The image below, courtesy of 4D Ocean, shows a beach profile running from land to underwater with the original terrestrial and bathymetric SfM points, and the refraction corrected SfM terrain model derived from same after the correction. The original terrain model's profile is colored in Red and the corrected one in Green.
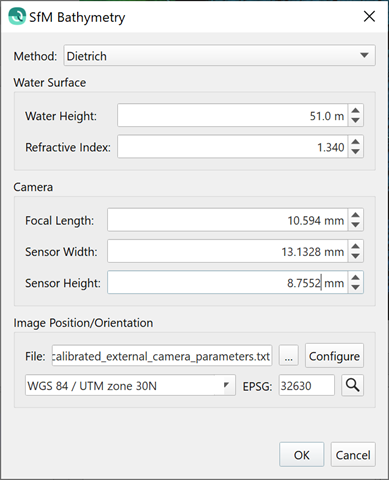
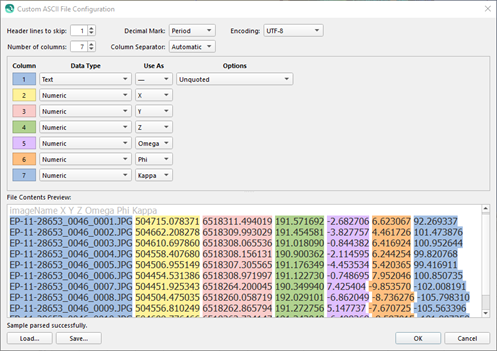
The new method requires the user to input several camera parameters such as focal length, sensor width/height. Additionally, the user must provide an ASCII input file that contains a list of the camera positions and orientations for each frame. We have some internal documentation on how to extract this camera sensor and position/orientation information from Agisoft and Pix4D SfM software. Please contact our Support team for more information on this if you need help.
Miscellaneous
Ability to create a plane
The user can create a plane object, and specify depth, color and transparency. This is shared tech from Fledermaus, where it has been available for quite some time and is a favorite feature for Fledermaus users.
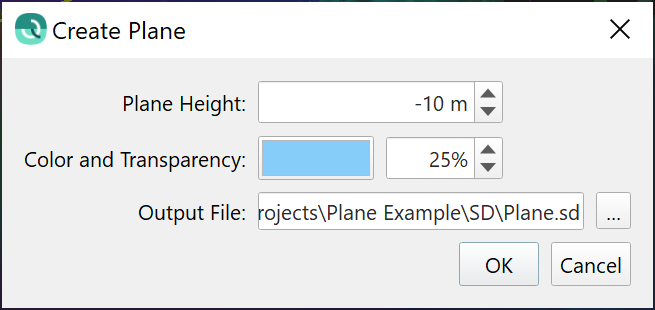
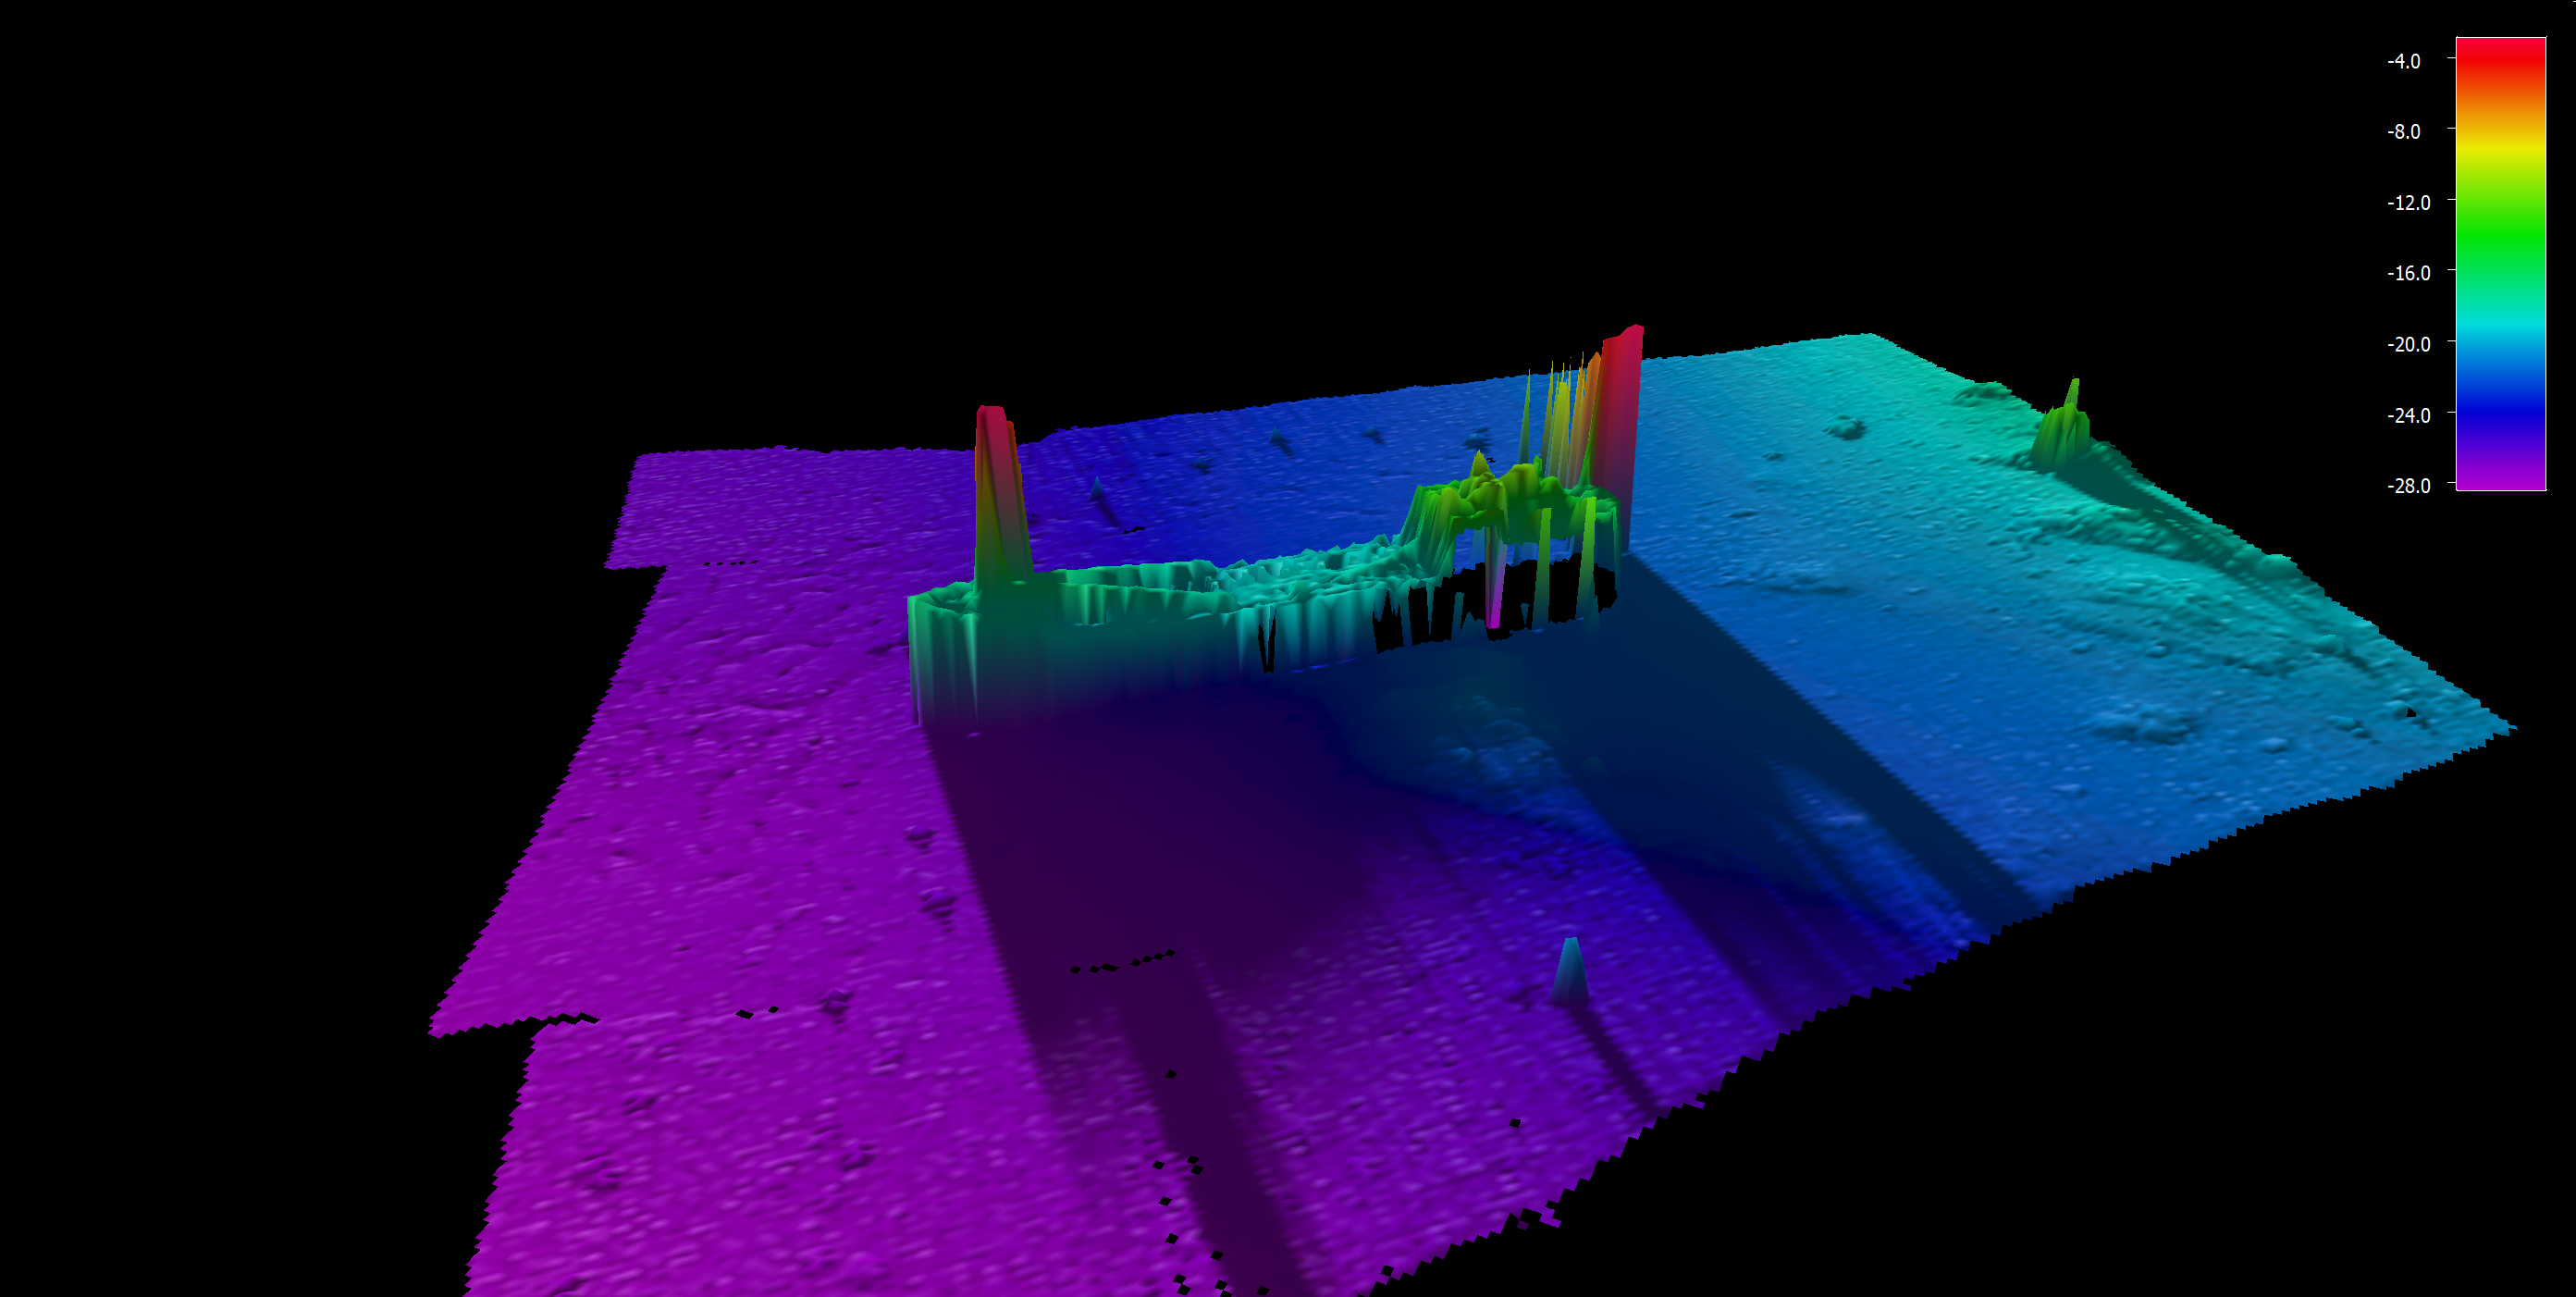
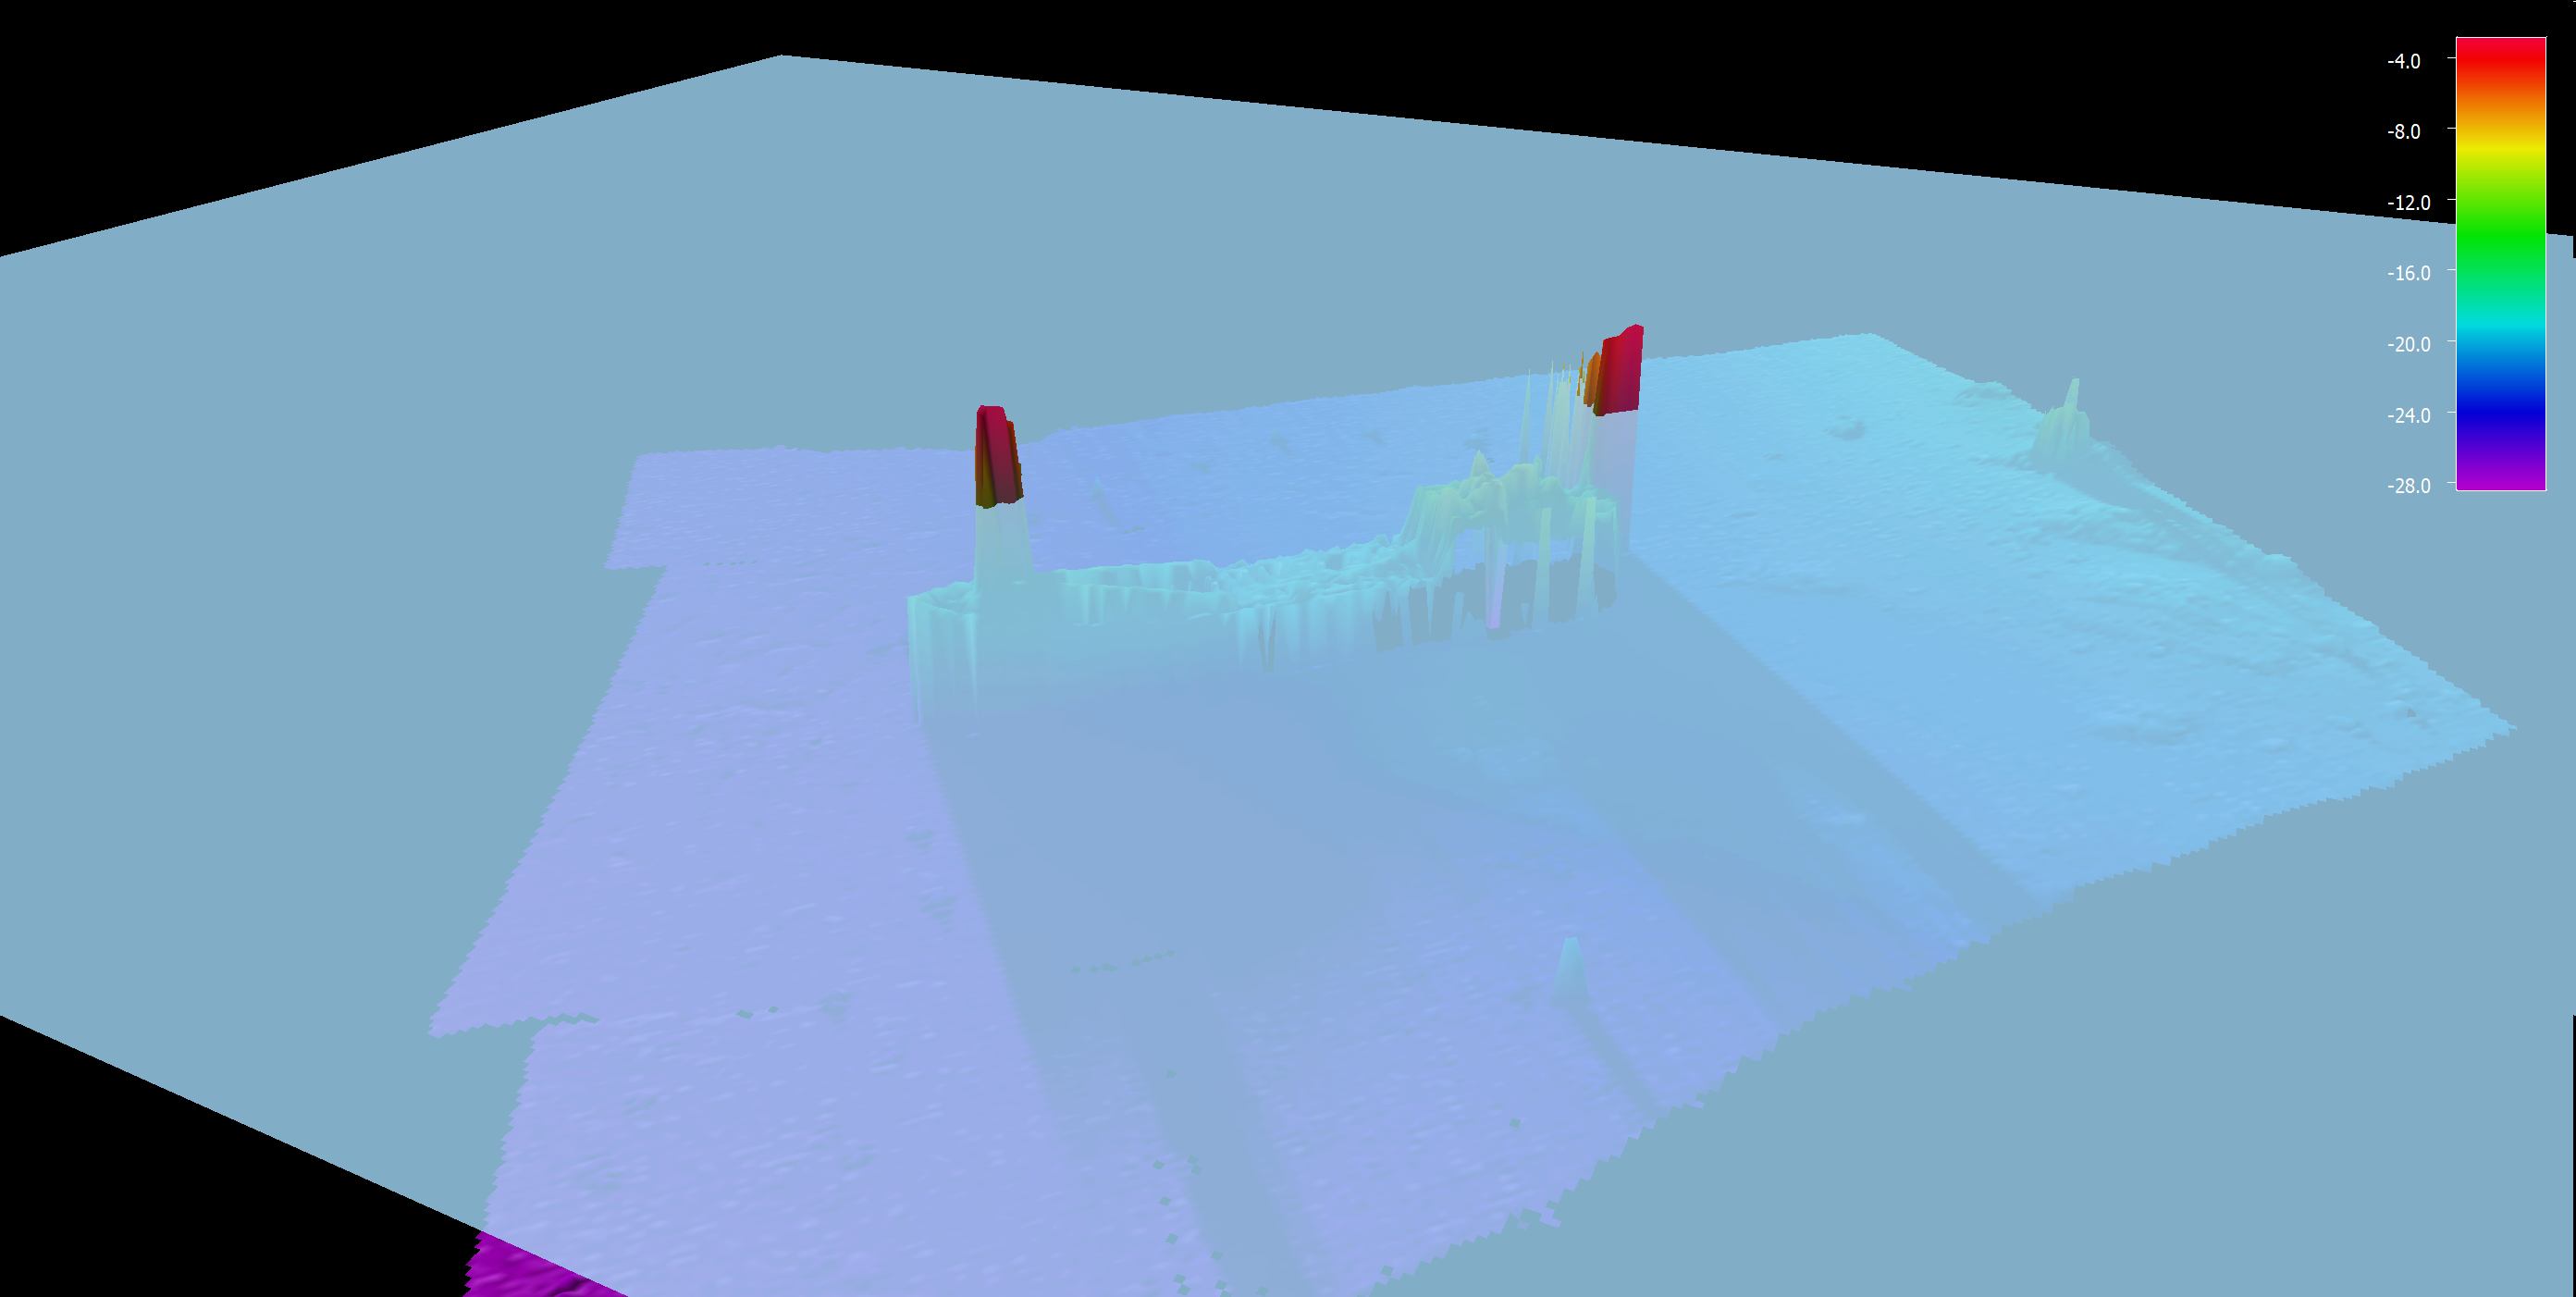
Creating a plane can have several different uses. The most typical use case, based on long established data review workflows in Fledermaus, is to create a plane at a certain depth to visually isolate areas that are shallower and deeper than the specified depth. For example, when examining navigationally significant depths you may want to create a plane that is -10 m and see the areas immediately where you should focus your attention to ensure that extra care is taken to inspect and/or clean data in those areas. The images below show this typical use case with a wreck in shallow water.
Coverage Extinction Plot
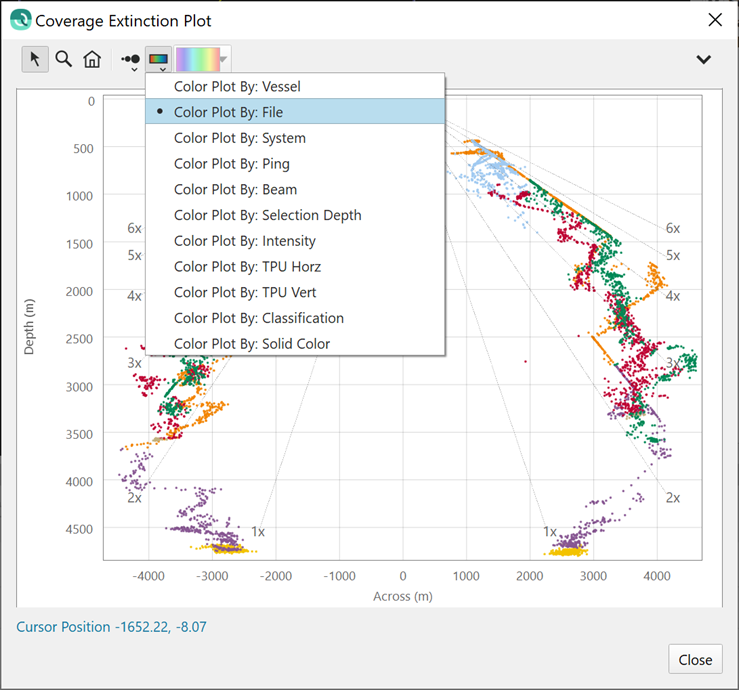
The Coverage Extinction Plot tool has been upgraded to align with the other tools for color by options, along with color map selection and adjustment capabilities. See the example below, which displays the result of coloring the data points by file. This functionality will let users make more meaningful plots when color coding by file if they design their field procedures to change the file when they change sonar parameters during sonar evaluation tests and trials.
Terminology Alignment
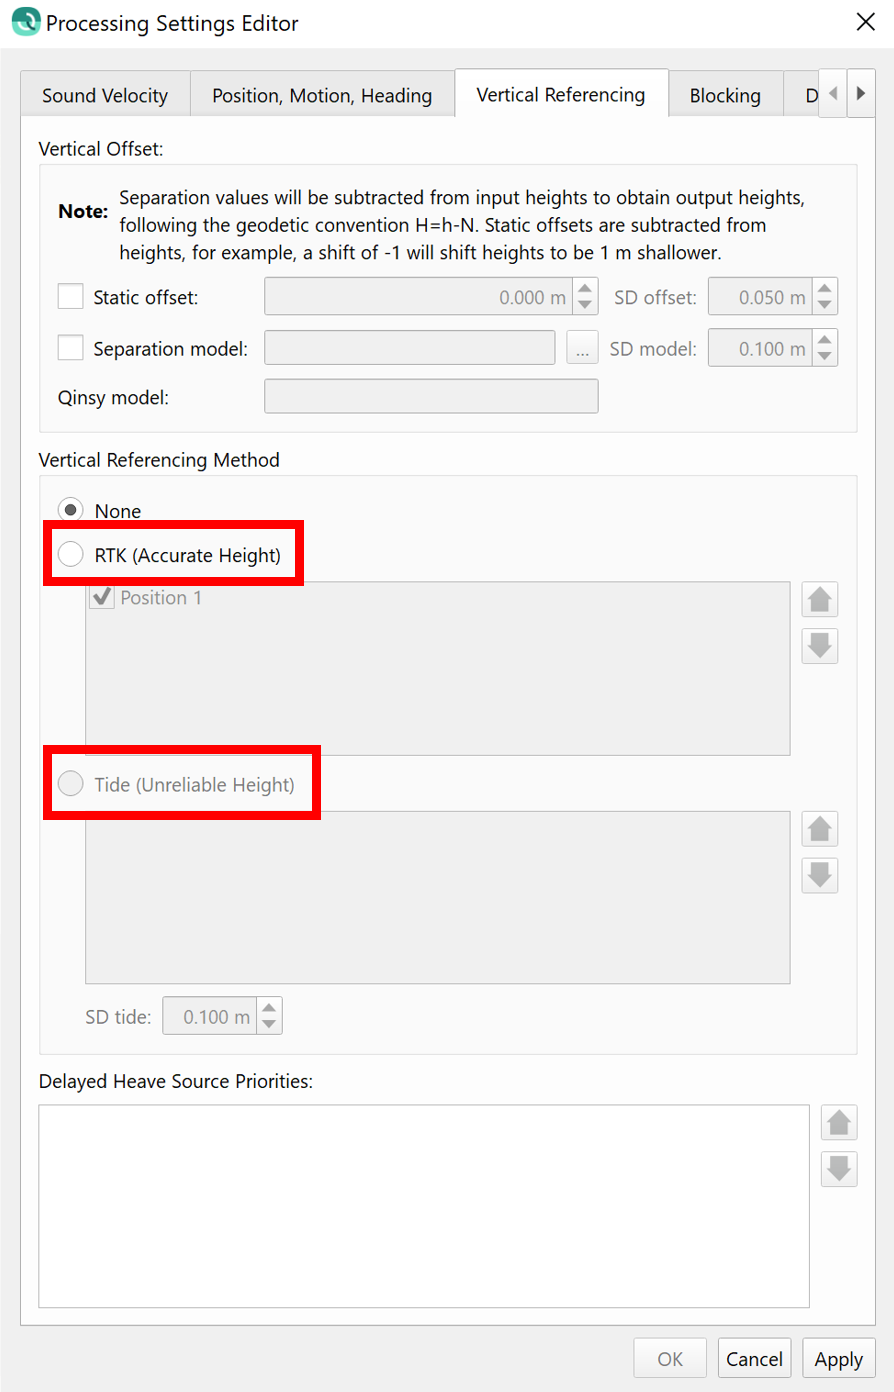
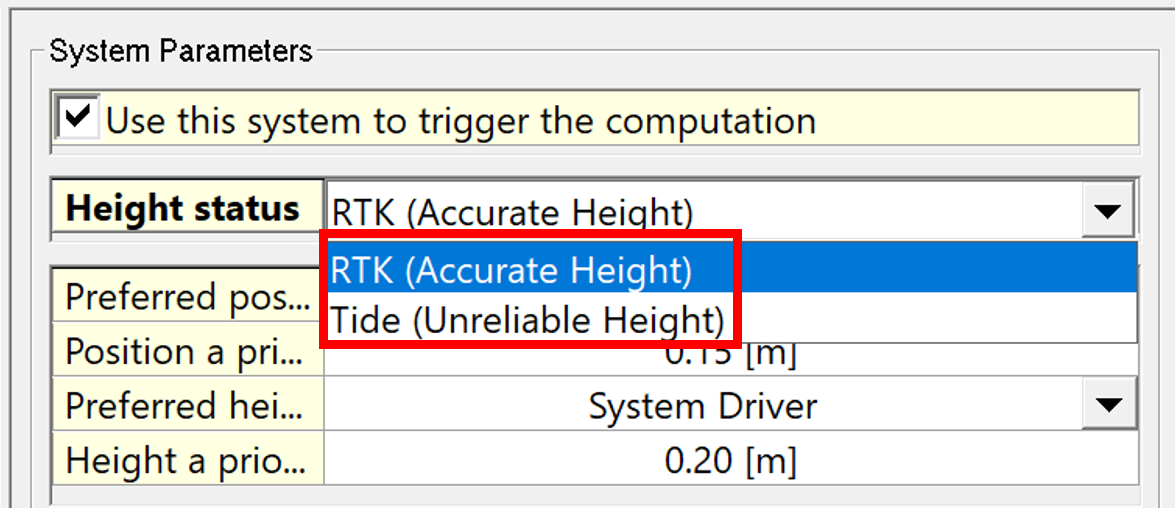
We have aligned terminology used in the Processing Settings Editor dialog Vertical Referencing tab with terms that were recently updated in Qinsy 9.0. Instead of GPS/GNSS and Tide, it is now "RTK (Accurate Height)" and "Tide (Unreliable Height)". See below for the dialog in Qimera and the corresponding terminology used in Qinsy's Computation Setup.
Surface Differencing
Surface differencing when using an area limitation specified by a user file is now clearly indicating that only ASCII XYZ format is supported. Prior to this, it was not made clear that only ASCII XYZ formats were supported; some users would encounter difficulty when attempting to use CAD file formats.
Scene, Display & Preferences
New User Preferences
We have a small set of new user preferences, described below with images showing their location in the preferences dialog.
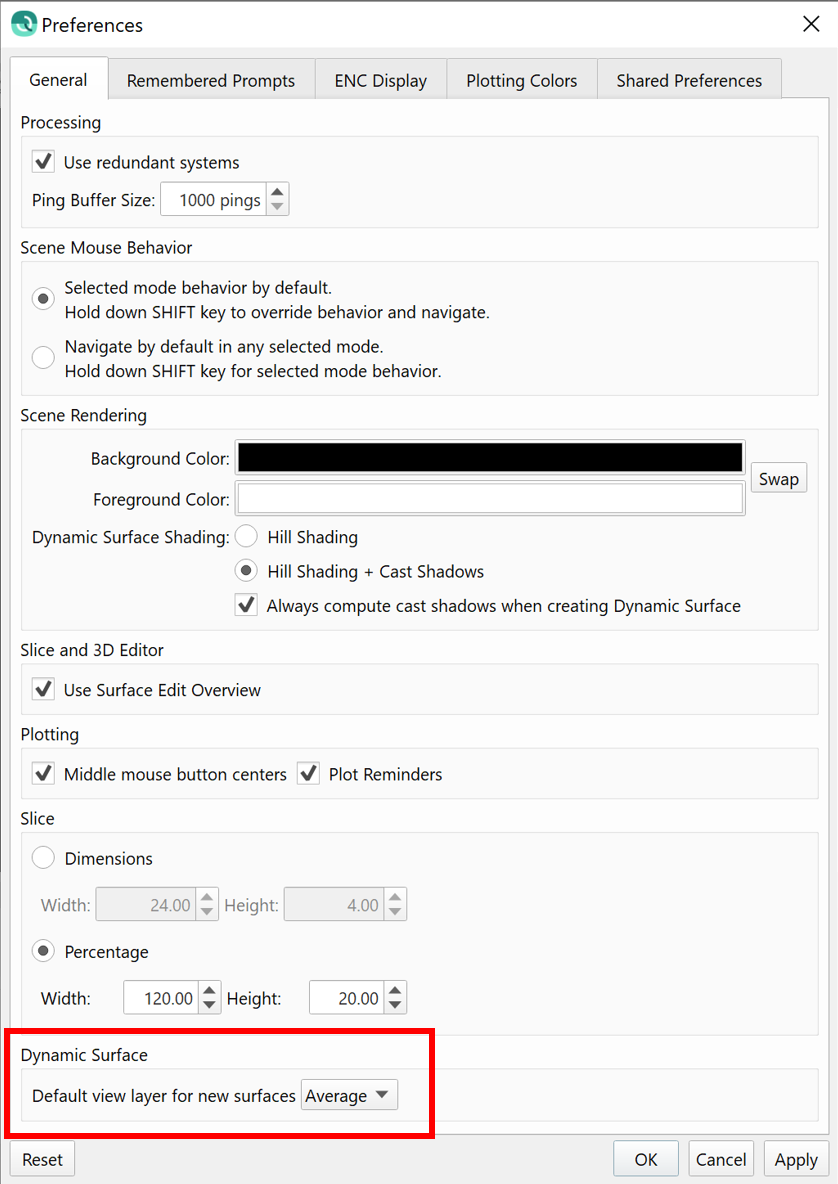
Ability to configure default view layer for a Dynamic Surface
There is a new user preference in the Preferences dialog that allows the user to configure which depth layer they would most like to see by default with a Dynamic Surface. This is aimed primarily at users who are mainly doing QA review for point cleaning. Often these users want to see the Shallow layer instead of the Average layer, since it highlights where there are outliers remaining. The default setting for all users is to view the Average layer.
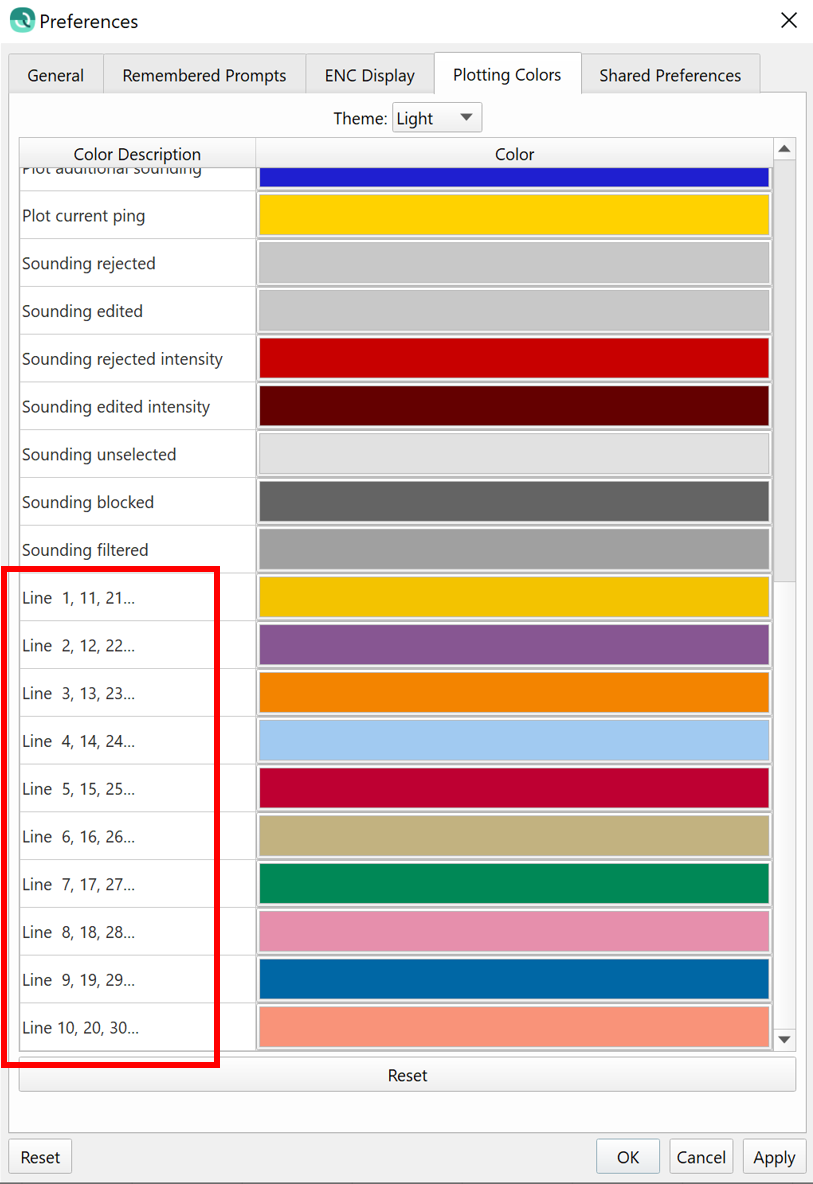
Control over default values used for line coloring
There is a new user preference to set up the colors that will be used in the automatic line coloring. These colors are used in the Slice Editor and Patch Test tool. In the Preferences, users will see the ten colors that are selected ("Kelly" colors), and they can adjust the coloration and have it saved as a custom theme. This new functionality allows the user to customize up to 10 "Color By Line" colors.
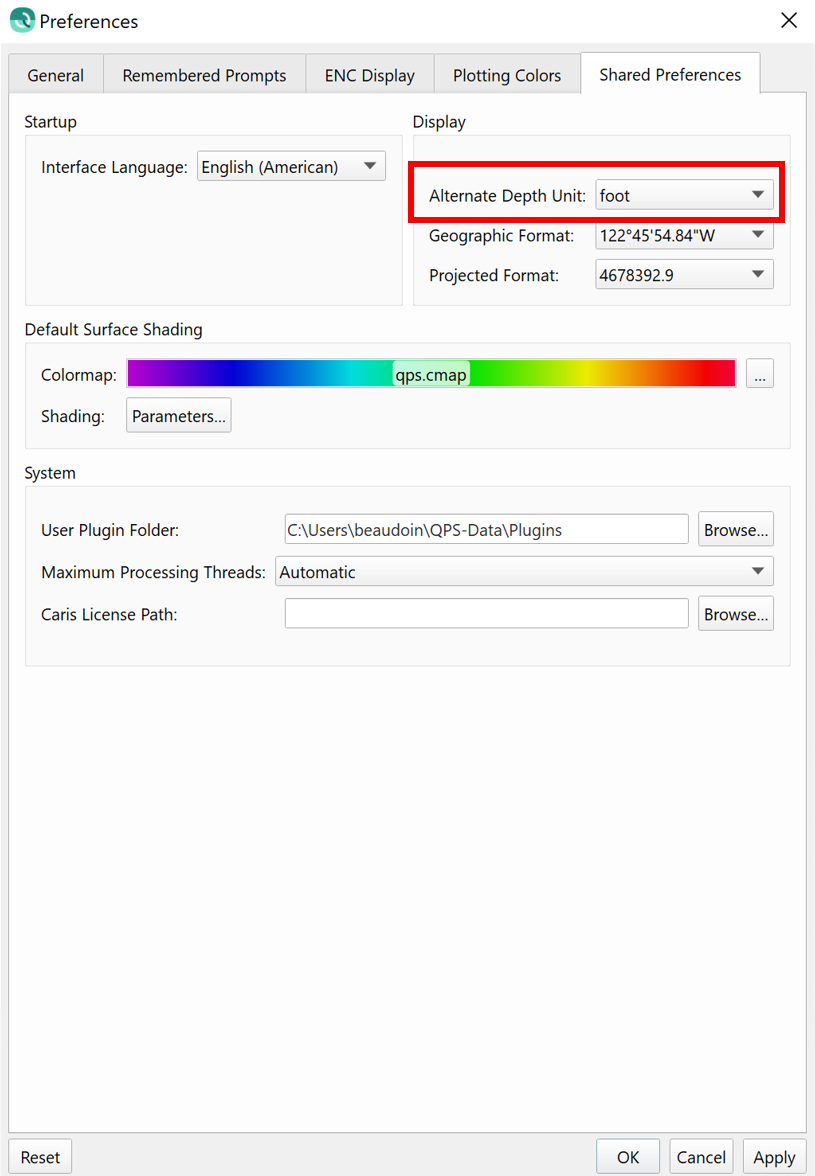
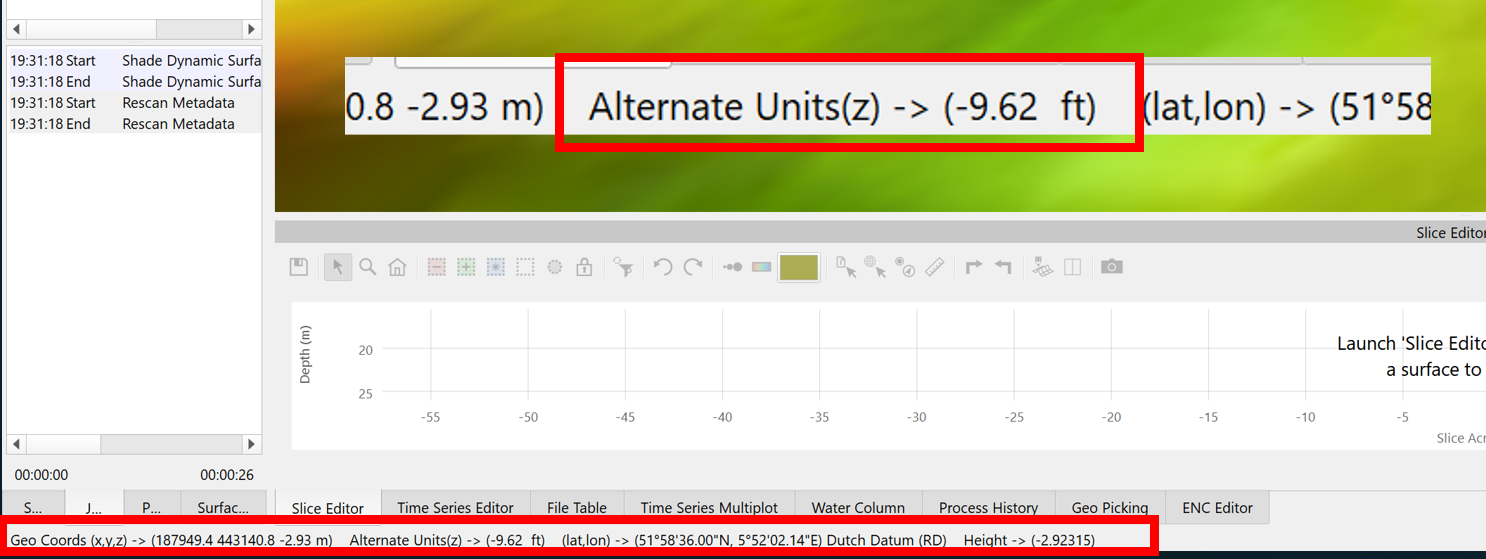
Ability to show depths in alternate units
There is a new user preference that allows the user to select and display an alternate depth unit for the depth that is at the user's current mouse position, which is displayed on the lower status bar. This new user preference is under the Shared Preferences in the Display section. This is applicable for users who like to work in meters, for example, but then need to compare their depths to soundings on an imported raster nautical chart that might be in fathoms or feet. Typically, it is expected to see this only used in the US or when comparing against historic charts in differing depth units.
Interface and Behavior
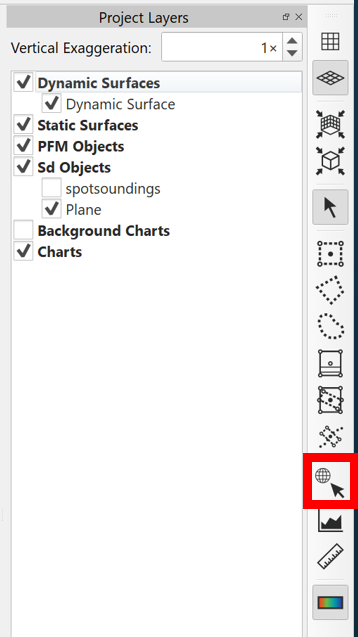
The icon for Geopick functionality on the main Scene toolbar has been modified to match that used in the Slice Editor and Swath Editor. It now has an arrow with the graticule icon.
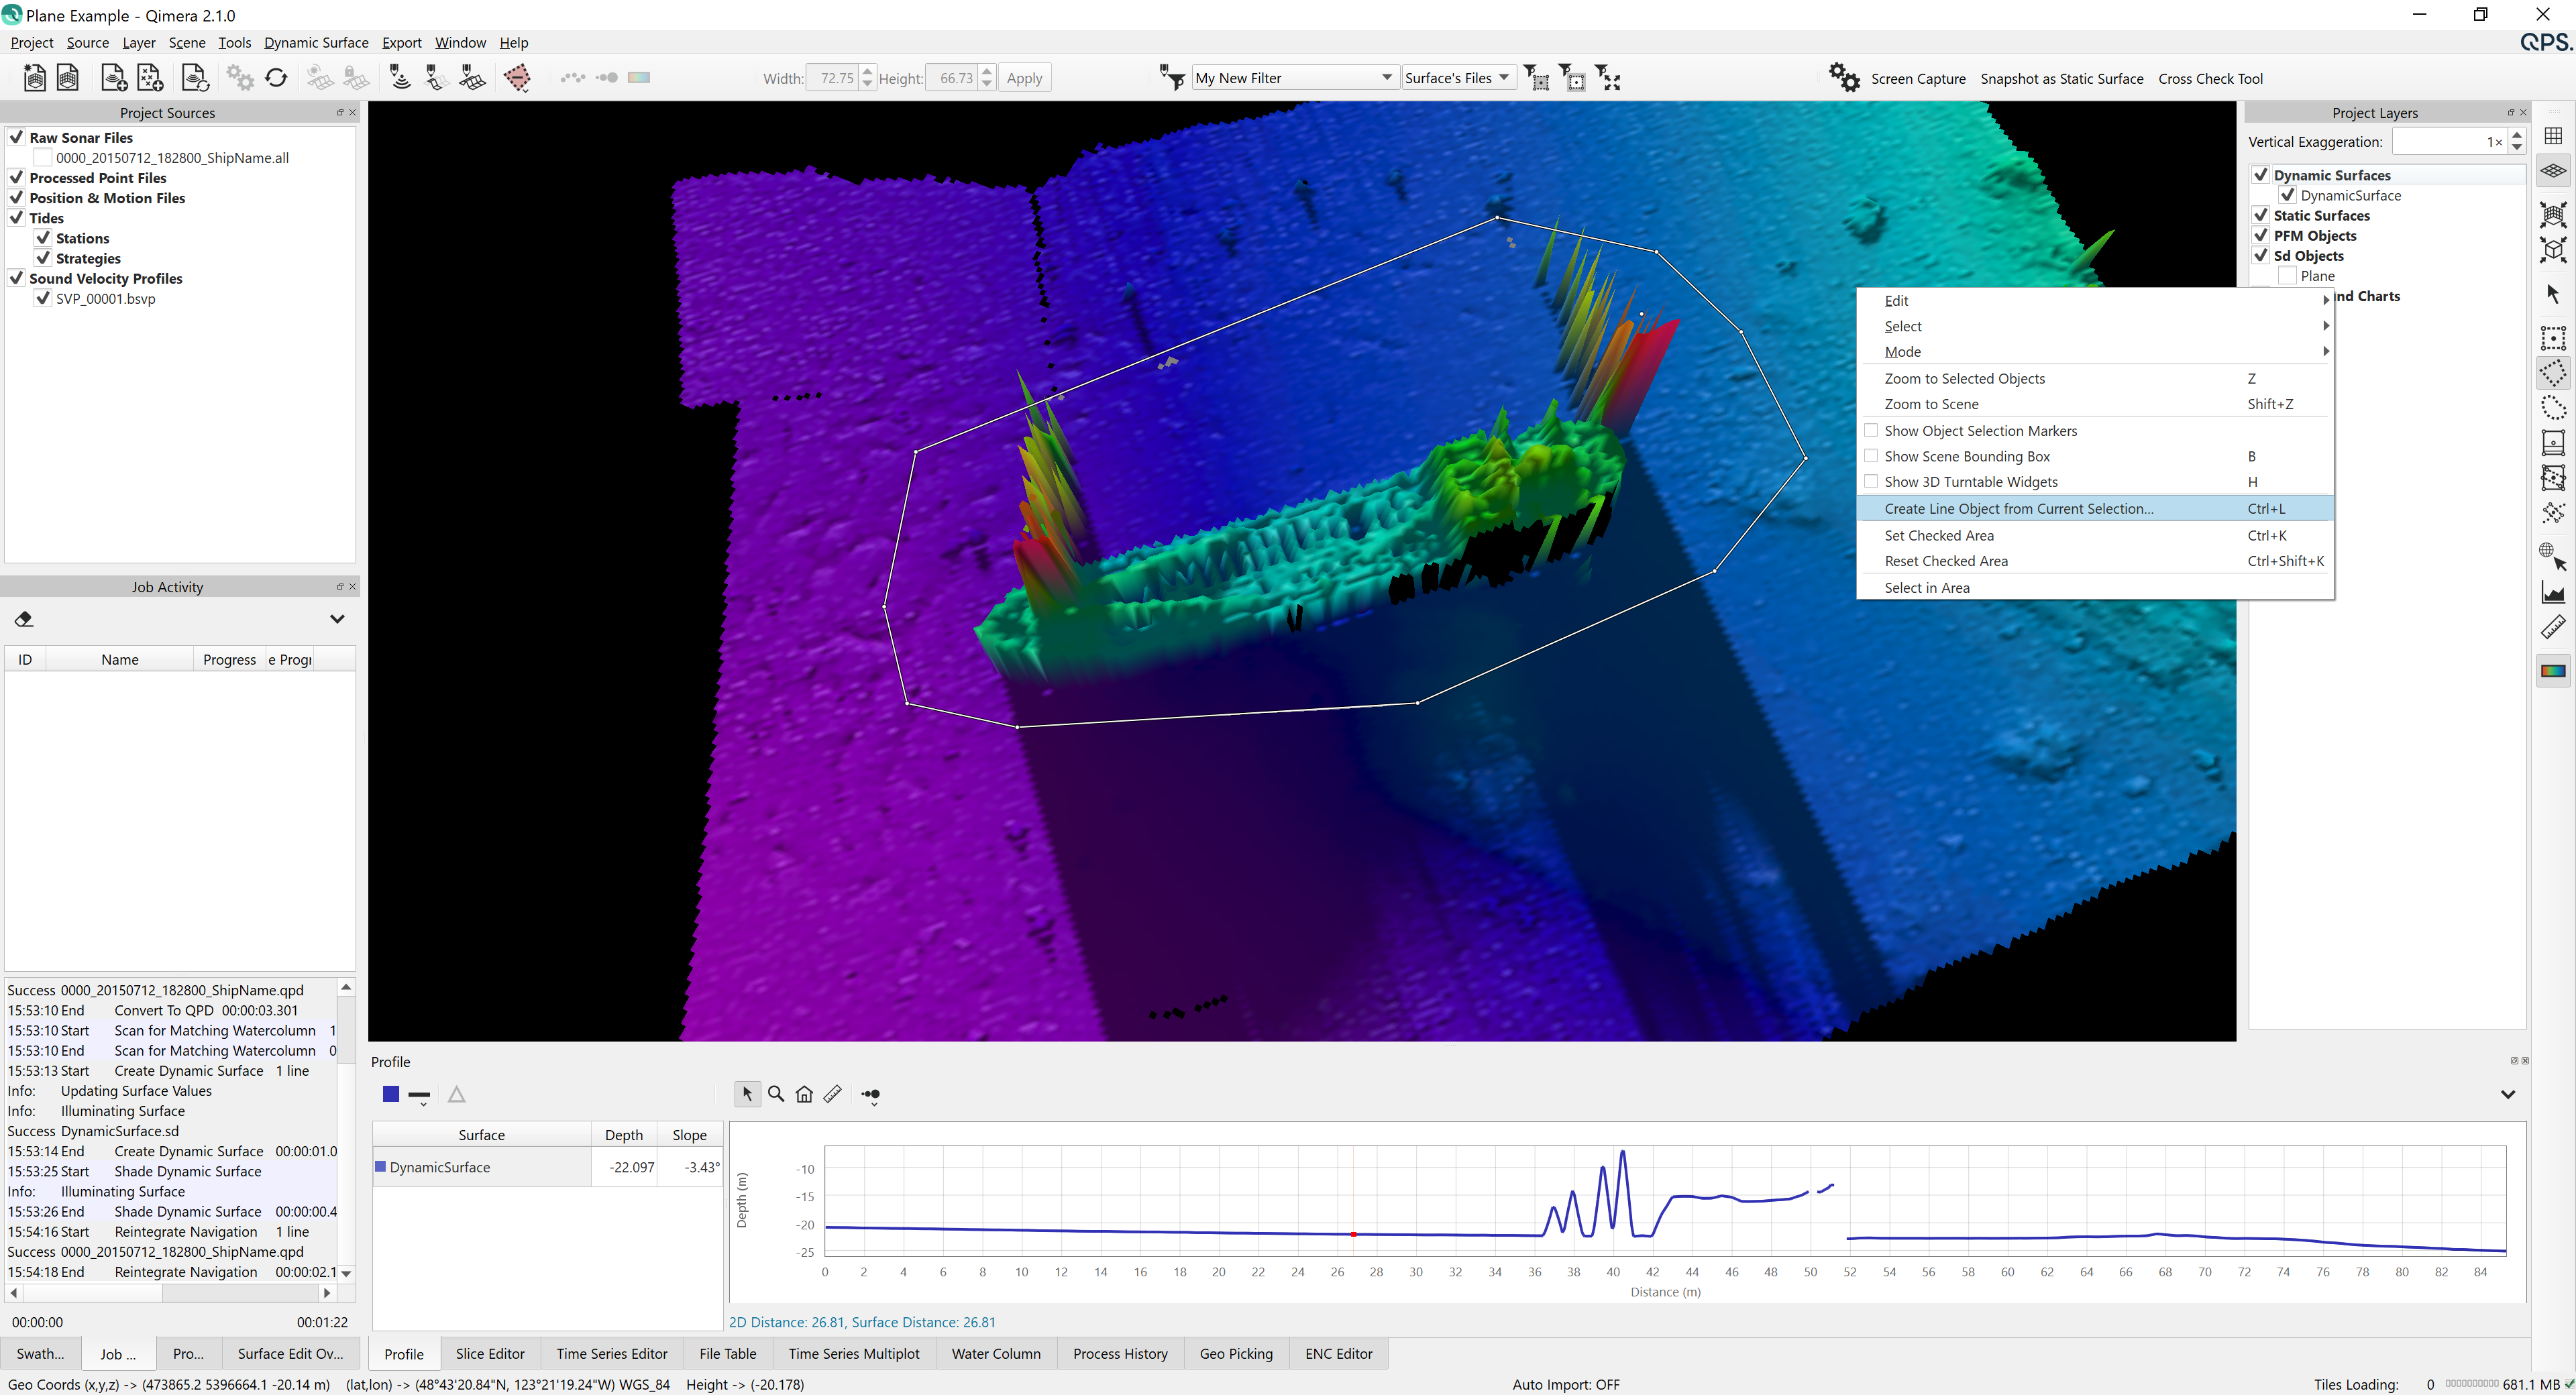
Saving line and polygon selections from the Scene as line objects now saves in the project's SD directory, having previously saved in Export directory. The image below shows a typical user action after drawing a polygon in the Scene, the right-click context menu allows you to save the current polygon as an .sd object which then appears in the Project Layers tree. This capability has been in Qimera for quite some time, so this is simply an update that we have corrected, resulting in the default save location of the resulting .sd file to be further aligned with user expectations.
Data Import & Export
Import
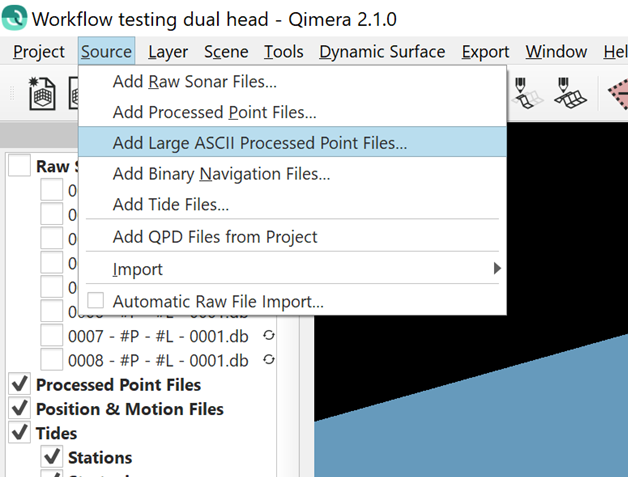
You can now import multiple "Large ASCII Processed Point" files at once. This is done for users who take delivery of data sets from contractors that supply a single ASCII file for the entire survey, and this file holds points from all survey lines. These users can now import several of these at the same time, previously, only one could be imported at a time.
Qimera can now import QPS QGF files with newer file extensions as CAD files. Previously, only import of files with a simple .qgf extension was supported. This now allows import of .qgfline files, etc. Direct support for QGF will come after we integrate the new Fledermaus 8 visualization engine, in which QGF can be drawn natively without the need for file conversion.
Import of Hypack HSX files will now clear the import Coordinate Reference System (CRS) field to make it clear that the user must take action to specify the CRS during import. Previously, it defaulted to show WGS84, which was not correct, yet also did not raise awareness that user intervention was required.
Export
Export of GSF was upgraded to v3.0.9 in Qimera 2.0.2. In version 2.1, the GSF exporter has been upgraded to now populate all the sensor specific fields for Kongsberg's new KMALL binary data format, along with snippet data. This allows for workflows for the newer KMALL format from Qinsy. As a reminder, the workflow for backscatter processing is shown below. Note that FMGT will also support the KMALL file format natively in a release timed with this version of Qimera.
- Record .db/.qpd files in Qinsy
- Do bathymetric post-processing and data cleaning in Qimera, export GSF
- Import GSF in FMGT to create backscatter products.
