Qimera 2.0.0 - Improvements
Interface
Main application toolbar changes
Starting at the top of the interface, users will notice that the project name is in the title bar of the application. Below this in the menu section, users will notice that we've added the QPS logo to the far right. Clicking this will launch web browser and will take you to the QPS website where you can access help, downloads, support information, etc. Of the default toolbars displayed at the top in the default layout, we have removed the Selection Movement toolbar to reduce clutter since this toolbar is not used as often as others.

The Scene Toolbar has had some lesser used visibility control buttons removed to reduce screen clutter as well. Users can find visibility controls in the Scene menu for: Show/Hide Scenes Bounds Box, Show/Hide 3D Turntable Widget and Show/Hide Object Selection Markers.

New customizable toolbar
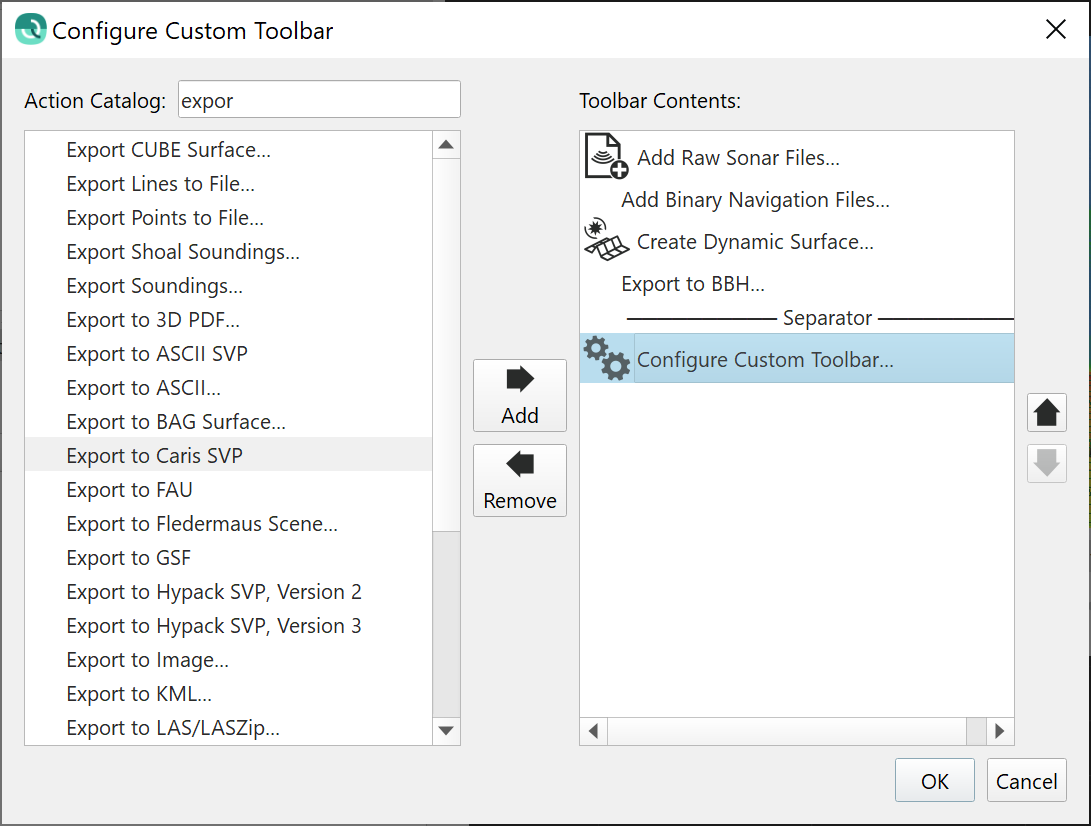
You can display your own custom toolbar on the main application interface, you can configure it to add buttons for any action from any menu. Below we show how one might configure a custom toolbar for a simple workflow of importing raw sonar data, adding binary navigation files, creating a Dynamic Surface and exporting a BAG.
Here's what the custom toolbar would look like in the application.

License and Maintenance Expiration Warnings
We have added warning banners to the Scene, using the same principle as the Guided Workflow banners. Users will now be informed when their licensing will expire (important for subscription, rental and short term licenses) and also when their Support and Maintenance will expire. Warning banners will appear at the bottom of the Scene, with an orange banner for Support and Maintenance expiration messages and a red banner for license expiration messages.
Docked Windows
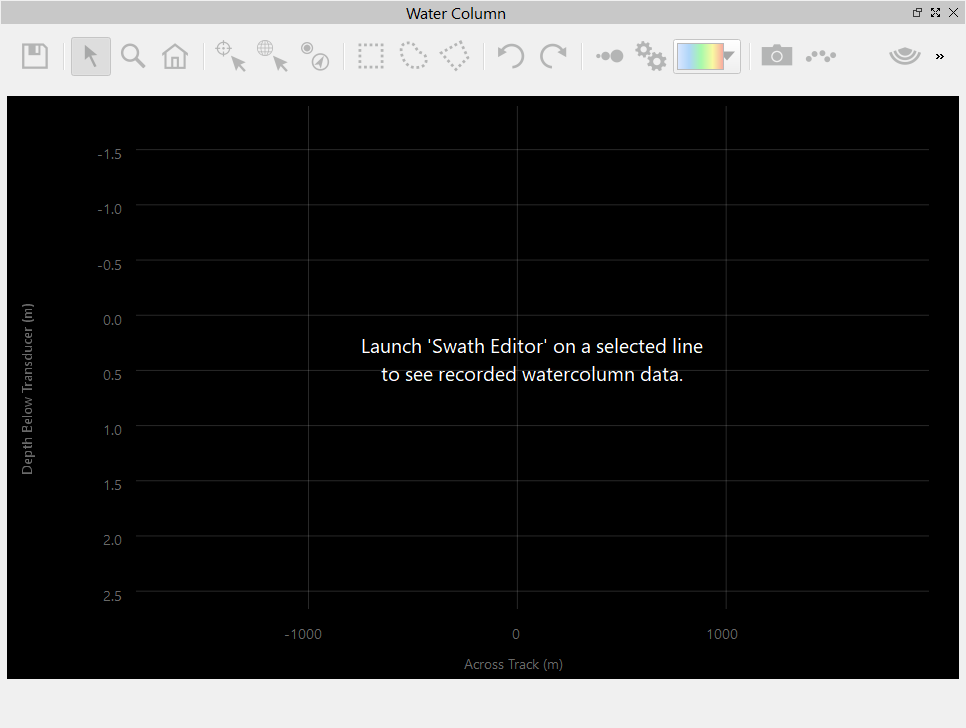
We've made two small improvements to docked windows. There is now a button to maximize a docked window, for use when it is undocked and floating. This allows you to maximize use of screen space for docks where you need a lot of graphic interaction like the Water Column or Slice Editor docks. A maximize icon will appear in any window that is undocked from the main application panel. Also, to improve usability, we have added text overlay cues in the docks to help users discover how to launch and use the tools that they'll find in the default display layout. Below you see an example of the Water Column dock, with the text cue steering the user towards launching the Swath Editor in order to visualize water column data.
Performance
Start up, Import and Export
We've improved the start up time for Qinsy users that open their projects in Qimera Clean by optimizing how we extract navigation track lines and basic ping metadata from QPDs. Depending on contents of the QPD, speed improvements range from 2x to 15x.
Qimera 2 also improves response times for large projects by optimizing how we read, write and update processing metadata tracking files after processing operations. For very large projects with hundreds of lines and hundreds of GBs, older versions of Qimera would run slower for operations like opening the project, adding new files to the project and closing the project once any significant processing had been done, like running the TU Delft Sound Speed Inversion algorithm. The speed to add files to such projects has improved by ~100x due to the optimized processing metadata file I/O. Project shutdown times have improved by about 20x.
There is now faster import of LAS/LAZ files, due to navigation extraction and QPD conversion being combined into single stage and also optimization of QPD conversion code. We see typically an improvement of 1.5x.
Lastly, we have rebuilt the exporter routine for Dynamic Surfaces now that we have a new grid file format. Exporting routines that convert the surface to an ASCII export now run with about a 10x speed improvement.
Interaction
We've made significant I/O improvements to reduce load time for point clouds into editors and also to filter toolbar operations, and regrid operations that occur immediately after localized edits from the Slice Editor and 3D Editor. With the new grid format, we've also addressed scalability issues in that localized editing, regridding and reshading is no longer dependent on the overall size of the grid. Our benchmark tests show 3x to 7x improvement, depending on hard drive type largely.
We've made some optimizations in how point editing actions are done themselves in that the lasso, polygon, rectangle and eraser modes in the Slice and Swath Editors are now much more responsive during editing operations. Previous versions of Qimera had some lag during the draw operations for these edit modes when viewing very large point clouds and this is now dramatically improved.
Dynamic Surfaces
Upgrade to GRID5
We have upgraded our Dynamic Surface file format to Grid version 5. This new format is supported in Qinsy 9, Qimera 2 and Fledermaus 8. With this upgrade, users will find that the format supports very large surfaces more effectively, it has faster I/O, faster regridding and re-illumination (especially for large surfaces). In Qimera, users will note that there is now consistent agreement between grid lattices used for standard and CUBE surfaces. Underneath the hood, we have retooled the way we capture file paths in the grid metadata files and it is now possible to move projects to and from network mapped drives, etc. The new format is also expandable to allow for future needs, like backscatter mosaicing, or any other type of surface that may be required like a live difference surface. We have further plans for Grid 5, so stay tuned to future releases to see what new tools and capabilities we will be adding.
Shading Improvements
As part of the upgrade to Grid 5, the shading engine has been rewritten from scratch. Users will find improvements such as consistent shading between surfaces, independent of z-range. We've removed the brightness dependency on cell size, previously the overall brightness of a shaded image was somewhat dependent on the cell size. For ease of explanation, we've relabeled the shading options of "Fast Shading" and "Mixed Shading" to be "Hill Shading" and "Hill Shading + Cast Shadows"; users will see this in the user preferences now. As part of this work, there is better agreement between the overall look and feel of a Dynamic Surface when the two different shading options are used. Also in the User Preferences, you will find that you can choose to skip the cast shadow calculations to speed up regridding in the event that cast shadows are not desired.
For the shading parameters, the shading azimuth and elevation parameters can be entered in real-world units, along with text entry for both of these. We've also changed a few of the default shading parameters to enhance the Cast Shadows for when that option is used. Users will notice that cast shadows are now significantly longer, this aids the human eye in detecting spikes and other artifacts.
CUBE
We've done a review of several grid related dialogs and have clearly and consistently named the CUBE layers that are mentioned across multiple dialogs: Dynamic Surface "Color by" combo box, Snapshot as static surface, Extract Dynamic Surface Layer, Cell Information dialog. Also, as per the advice of Dr. Brian Calder at the University of New Hampshire's Center for Coastal and Ocean Mapping (UNH/CCOM), we have changed the default CUBE parameters for the Shallow Water configuration as follows:
- Queue Length changes from 11 to 1
- Quotient Limit changes from 30 to 255
Gridding and Other Grid Based Operations
We've made some improvements to the interface used to create Dynamic Surfaces. You can now Limit the Vertical Bounds during the creation of a Dynamic Surface, this is used to create depth banded surfaces which is a typical NOAA grid deliverable. Previously, this was done by first creating an overall Dynamic Surface and then creating a Clipped Surface.
We've added some new tools for Dynamic Surfaces. First off, by popular demand, we have added the ability to interpolate small holes in the grid. For this, we have re-used the tool set that is available in Fledermaus. In the future, we will seek to standardize on how this is done by combining the methods available in Qinsy, Survey Manager, Qimera and Fledermaus.
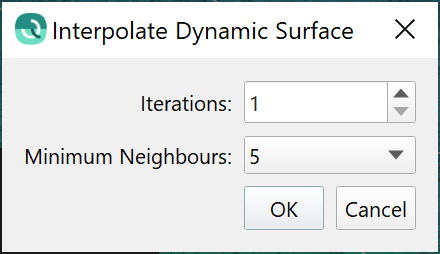
We've added two new tools for Dynamic Surfaces that are available with a quick right-click of the file: you can re-grid to a new resolution or you can Duplicate a surface to a copy but change the gridding parameters as you do so.
In terms of workflow for Dynamic Surfaces, we've found that some users were being surprised by some of the grid creation and extraction dialogs, which were quietly using a spatial selection to constrain the bounds of the surface. The behavior now is that the user must choose to constrain the bounds of the selected grid prior to executing operations. This will happen for the following operations: Create Dynamic Surface, Snapshot as Static Surface and Extract Dynamic Surface Layer.
One last detail was taken care of regarding Dynamic Surfaces. When a user decides to delete a Dynamic Surface from the project, the confirmation dialog now defaults to delete the file from disk as well. Previously, the file remained on disk by default.
Coloring and Visualization
There are two new Color By options for Dynamic Surfaces: Color by Rejected and Color by Interpolated. Color by Rejected allows users to easily see which cells have had any soundings rejected, this is useful in quality assurance stages where one user may want to ensure that another user did not reject too many data points, for example. The Color by Interpolated option shows which cells are interpolated.
We've added a few keyboard shortcuts as well. The F5 key will now trigger a refresh of the Dynamic Surface's rendering, in the event that the tile loading/caching/display has a problem. There are also new keyboard shortcuts to swap the view between different depth layers (Deep, Average, Shallow) and Color By options. The labeling of Opacity has been changed to Transparency, for clarity and ease of understanding.
Slice Editor and 3D Editor
Area Selections
For Slice and 3D Editing, have created a new quick size Selection Dimensions Toolbar that lets users quickly adjust the size of the area selection. This toolbar is not displayed by default, users can launch it from the Window menu.

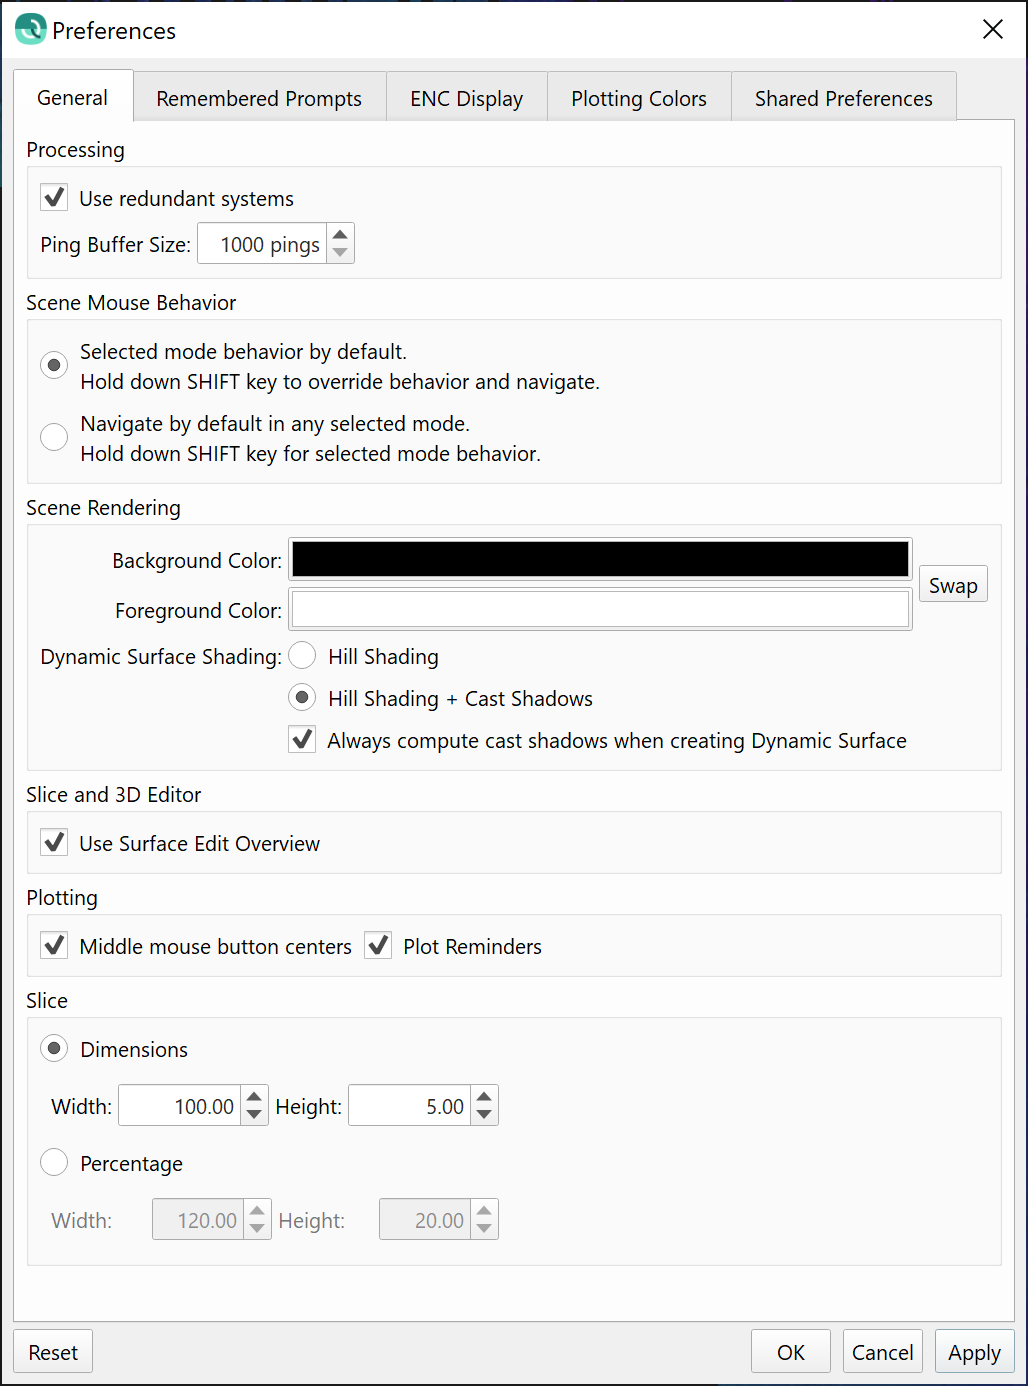
There is also now the capability to set a default set of dimensions for the inner slice for both Fixed Slice and Free Slice modes. You can access this from the General tab on the Preferences dialog, as shown in the two images below. The new capability allows users to choose a default set of dimensions, in survey units, for the width and height. Alternately, these dimensions can be configured to be a percentage of the outer selection of the Fixed or Free Slice outer rectangular selection. The two examples below show the inner box chosen to be 100 m wide by default and 5 m high. For the percentage option, the inner slice will be drawn 120% of the width of the outer selection and the height will be 20% of the outer selection's height. Setting the default inner slice dimensions to a fixed set of dimensions allows users to quick draw outer slice selections and then skip having to resize the dimensions of the inner slice.

We have satisfied a popular request as well to combine the rotation capabilities of the Fixed Slice mode into the Free Slice mode. The Free Slice mode will now allow for independent rotation of the inner and outer selection areas. Previously, the outer selection could not be rotated.
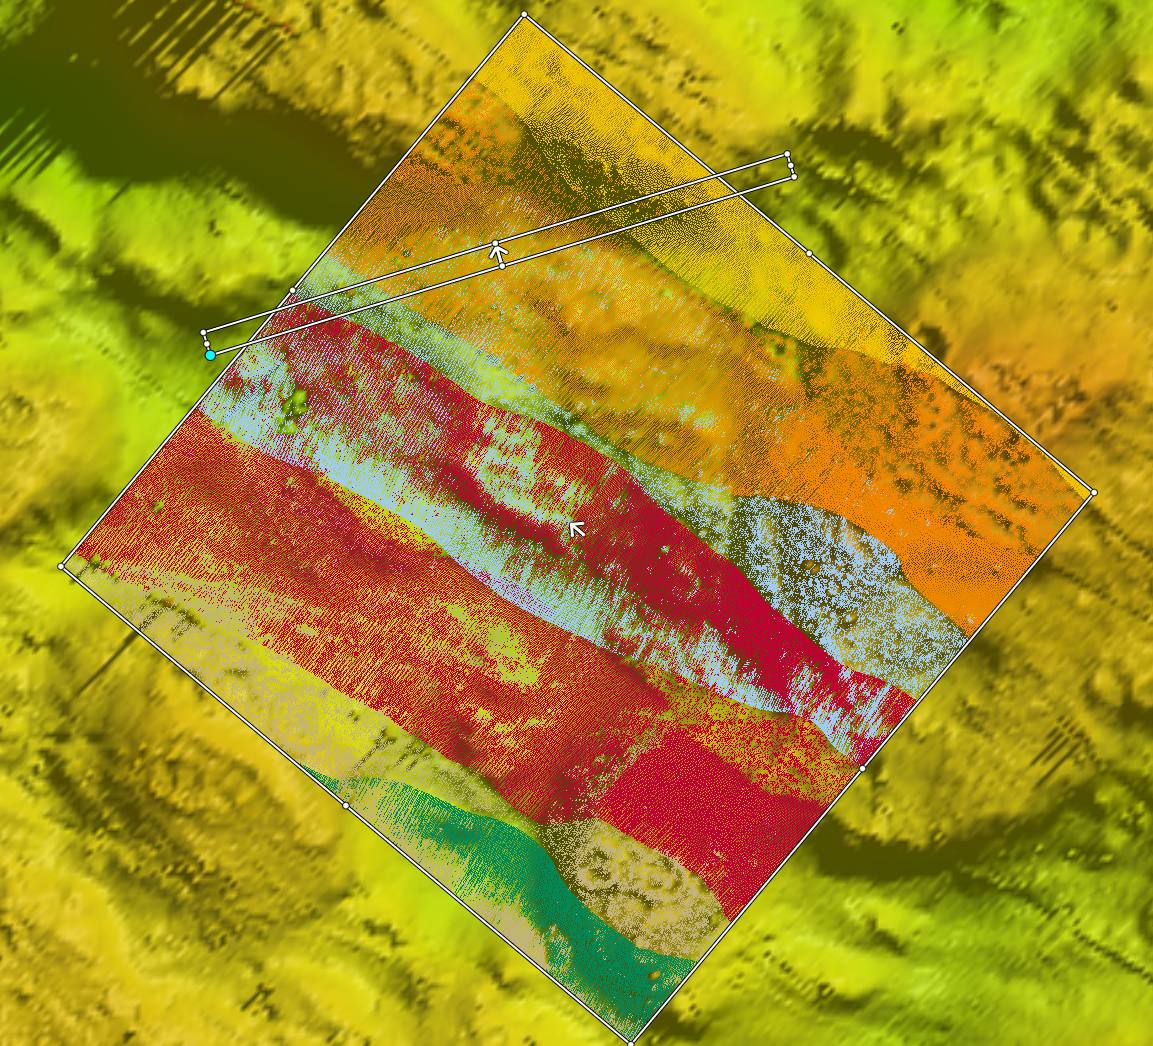
In our review of all the selection modes that are used for Slice Editing and 3D Editing, we made all the keyboard shortcuts consistent to resize the height of the Rectangle, Fixed Slice, Free Slice and Scroll Slice selection modes, both for the inner selection (+/-) and outer selections (Shift +/-). These all now act consistently with the keyboard shortcuts for quick resizing. In doing this, we also fixed a few small bugs that affected the usability of the Scroll Slice selection mode, particularly with the start up mode when a scroll line is not selected.
Coloring
Another popular user request was satisfied by adding control for the color map selection and range for point color coding in the Swath Editor, Slice Editor and 3D Editors. Users will notice a new color bar icon in the Slice Editor toolbar, seen below.

There is also a new color by option that lets the point cloud's color coding automatically match the color map of the Dynamic Surface that is being worked on. This can be found in the Scene Editor toolbar as well, and in all the point editors.
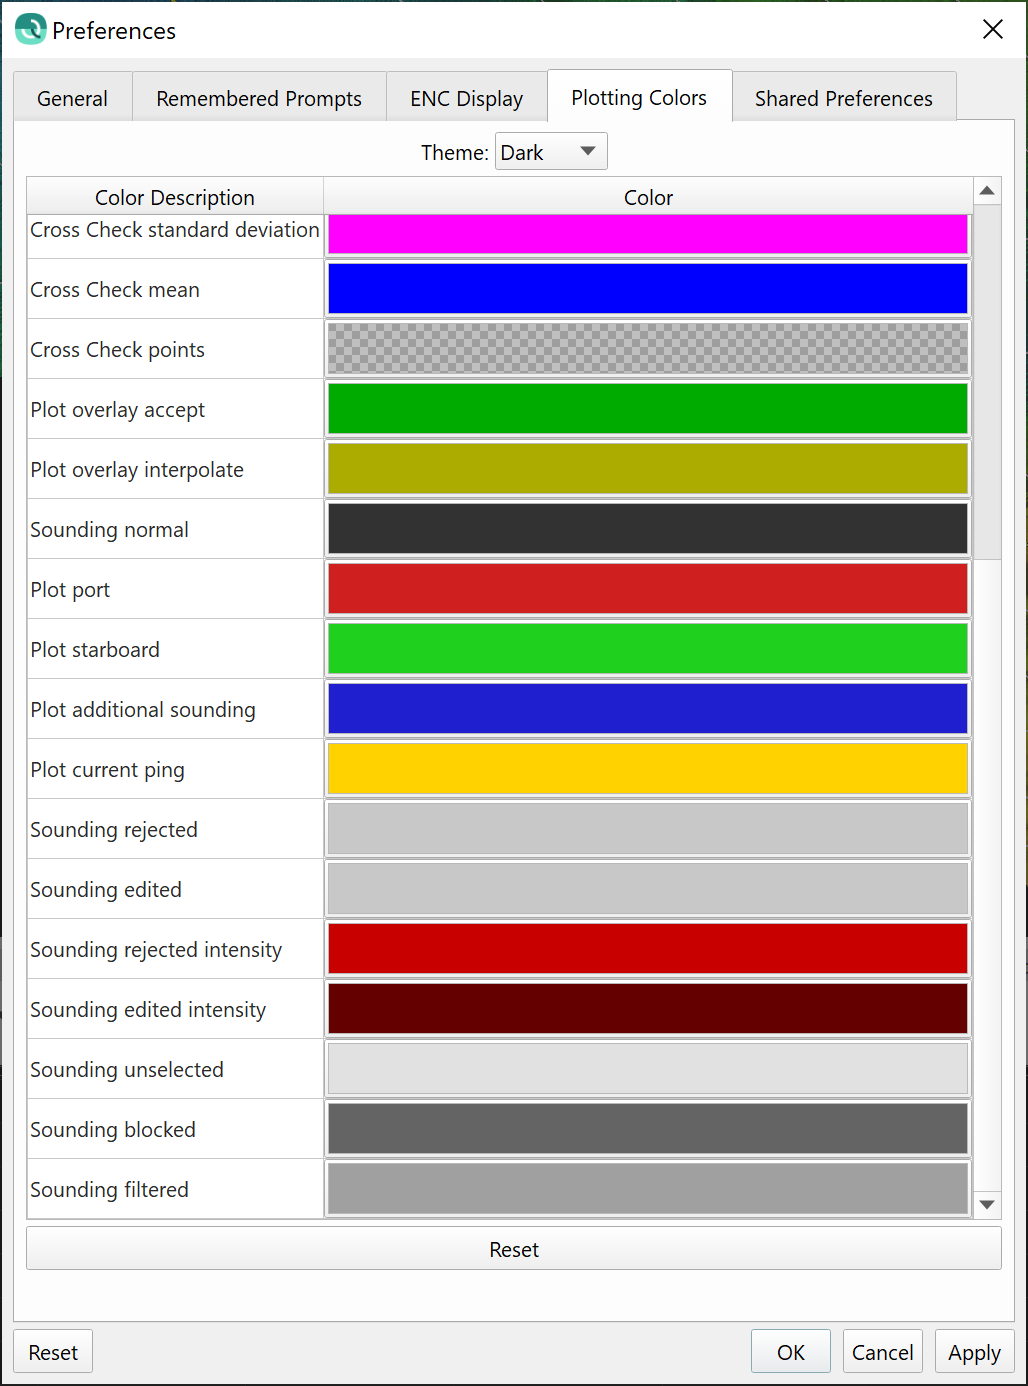
Lastly, as mentioned in the New Functionality section, there is now capability to configure the coloring of filtered and manually edited points. This is accessed in the Preferences dialog under the Plotting Colors tab, and is shown below, where you can see that users now have very granular color coding control over coloring of rejected soundings.
Miscellaneous
Polygon selection for point editing in the Slice Editor will now allow users to click outside of the drawing area, this is sometimes handy when editing points near the boundaries of the draw area.
A center profile from the Dynamic Surface is now drawn in the Slice Editor and also on the Dynamic Surface, this is to give quick context of the gridded depths along the profile while doing editing operations in the Slice Editor. Any edits that are saved that would normally trigger regridding will also update the profile.
The 3D Editor has had an improvement to populate the time attribute for ENC objects that are created within the editor when using the functionality of the ENC Plus add-on.
File names for source files are consistently displayed in the point information dialogs (Slice and Swath Editors) and the 3D Editor main panel. Previously, in some locations Qimera was displaying full file paths and in others it was displaying just the file name. In all cases, it now just displays the file names.
General Improvements
Control over color coding of plotted items throughout Qimera
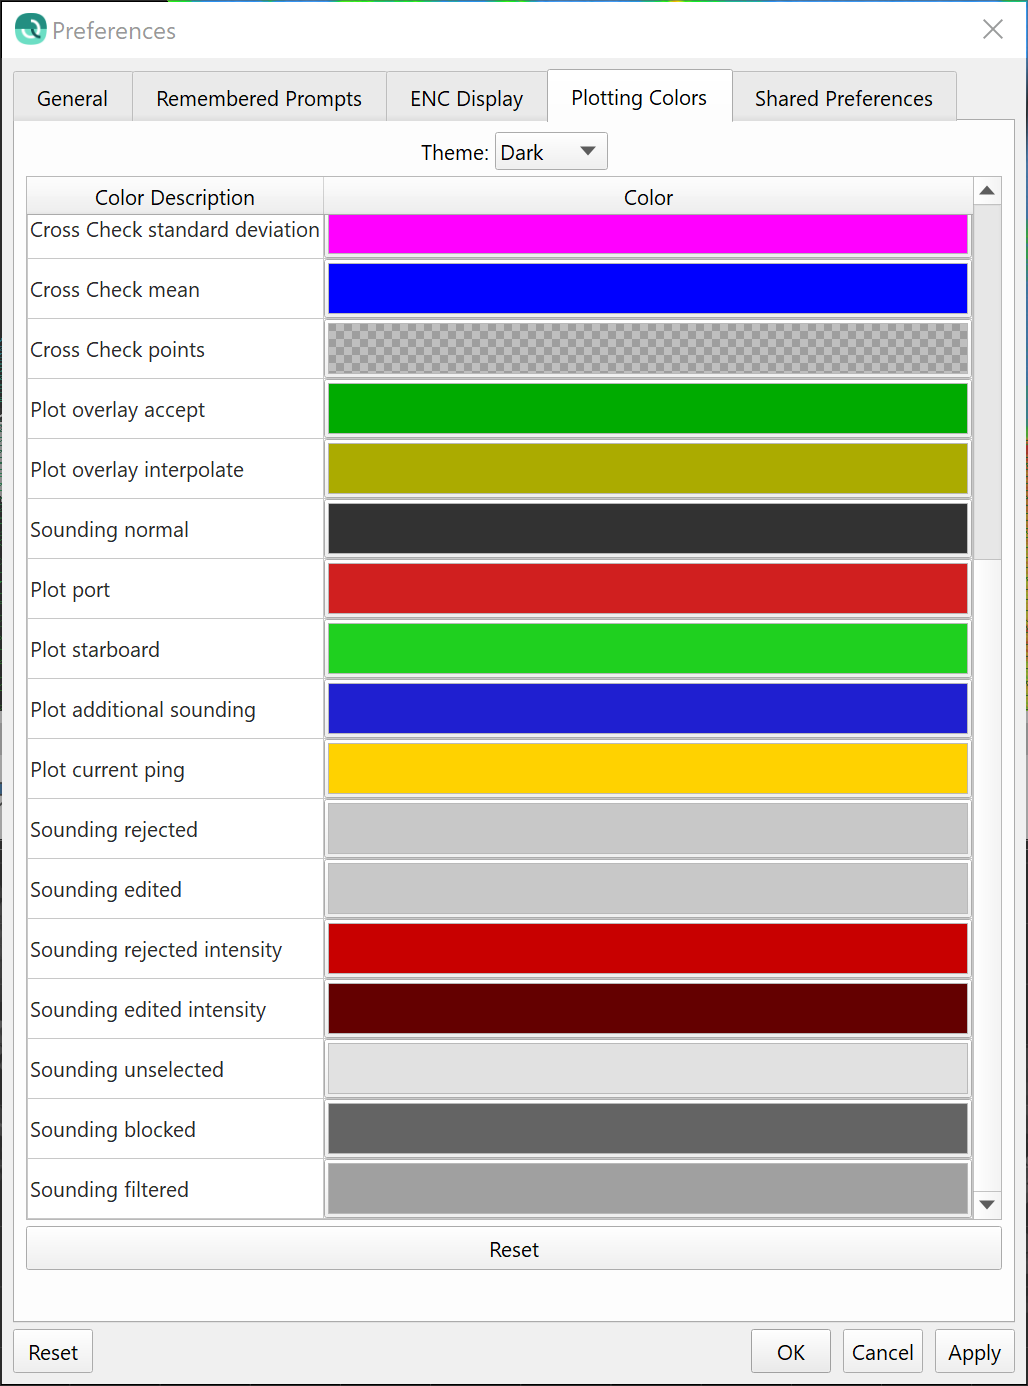
Qimera has many plots, from point editors like the Slice Editor to data analysis tools like the Cross Check tool. We've centralized point and line coloring options for all of the various plotting tools in the Preferences menu in a new tab, as shown below. Users can choose from a Dark or Light theme, or come up with their own custom theme. The most common use case that drove this development was a desire to change the color of rejected points in the Slice Editor. Once we started down the path of satisfying that request, we decided to expand it to cover all of the plotting tools.
Improvements to screen capture capability
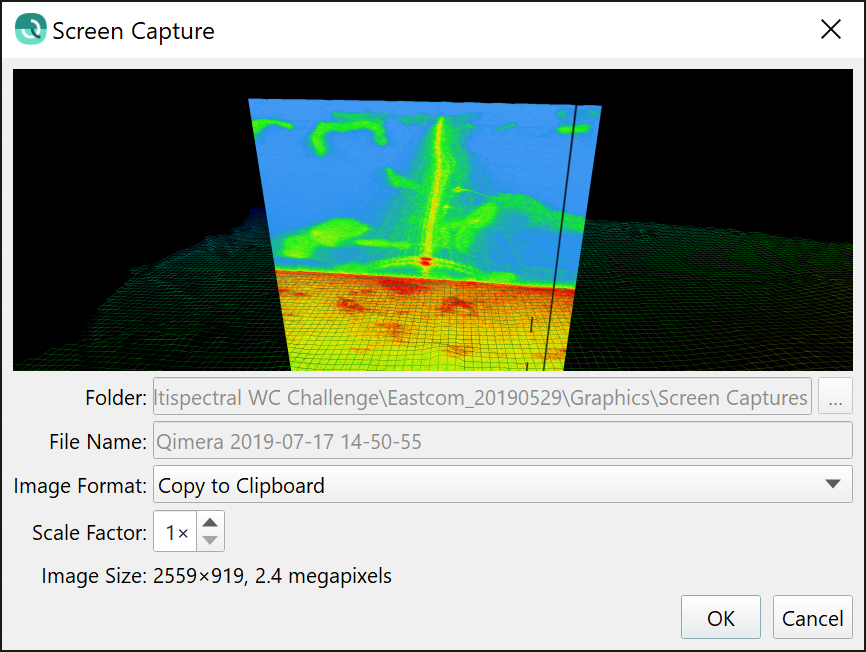
There is now a thumbnail image showing a preview of the screen capture, and the default filename is changed to a name with date and time. Users can also now copy the image directly to the clipboard, in addition to the file formats previously available.
Coloring, Display and Visualization
We have chosen a new common default color map for our applications and this is now shared by Qinsy, Survey Manager, Qimera and Fledermaus. After some investigation both internally and with external input from visualization experts at the University of New Hampshire, we have decided to use the Fledermaus default color map for all our applications. There is no change for Qimera and Fledermaus users, as this was already the default color map. The only change for Qimera users is that the default color map is now named to qps.cmap, previously this was 'colorsinterp.cmap'. The default file location is different between Qinsy and Qimera, but this will be improved in future releases so that all applications share a common color map directory and resource files.
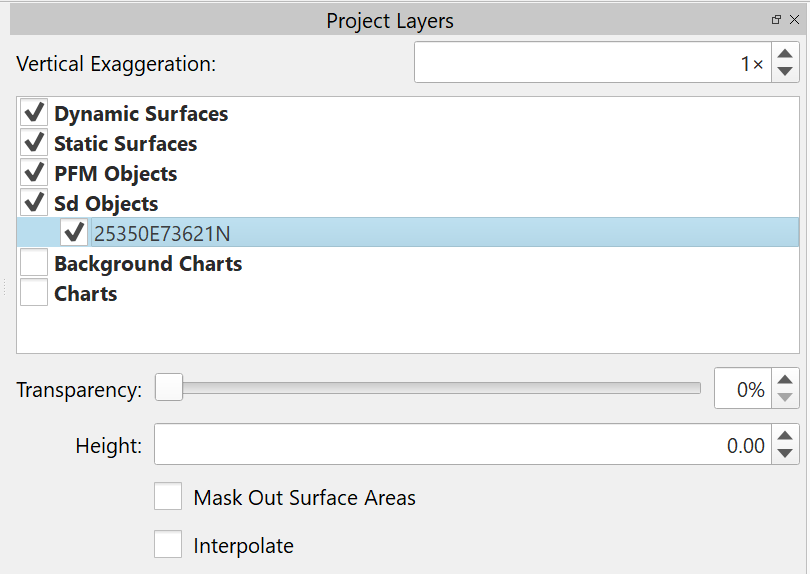
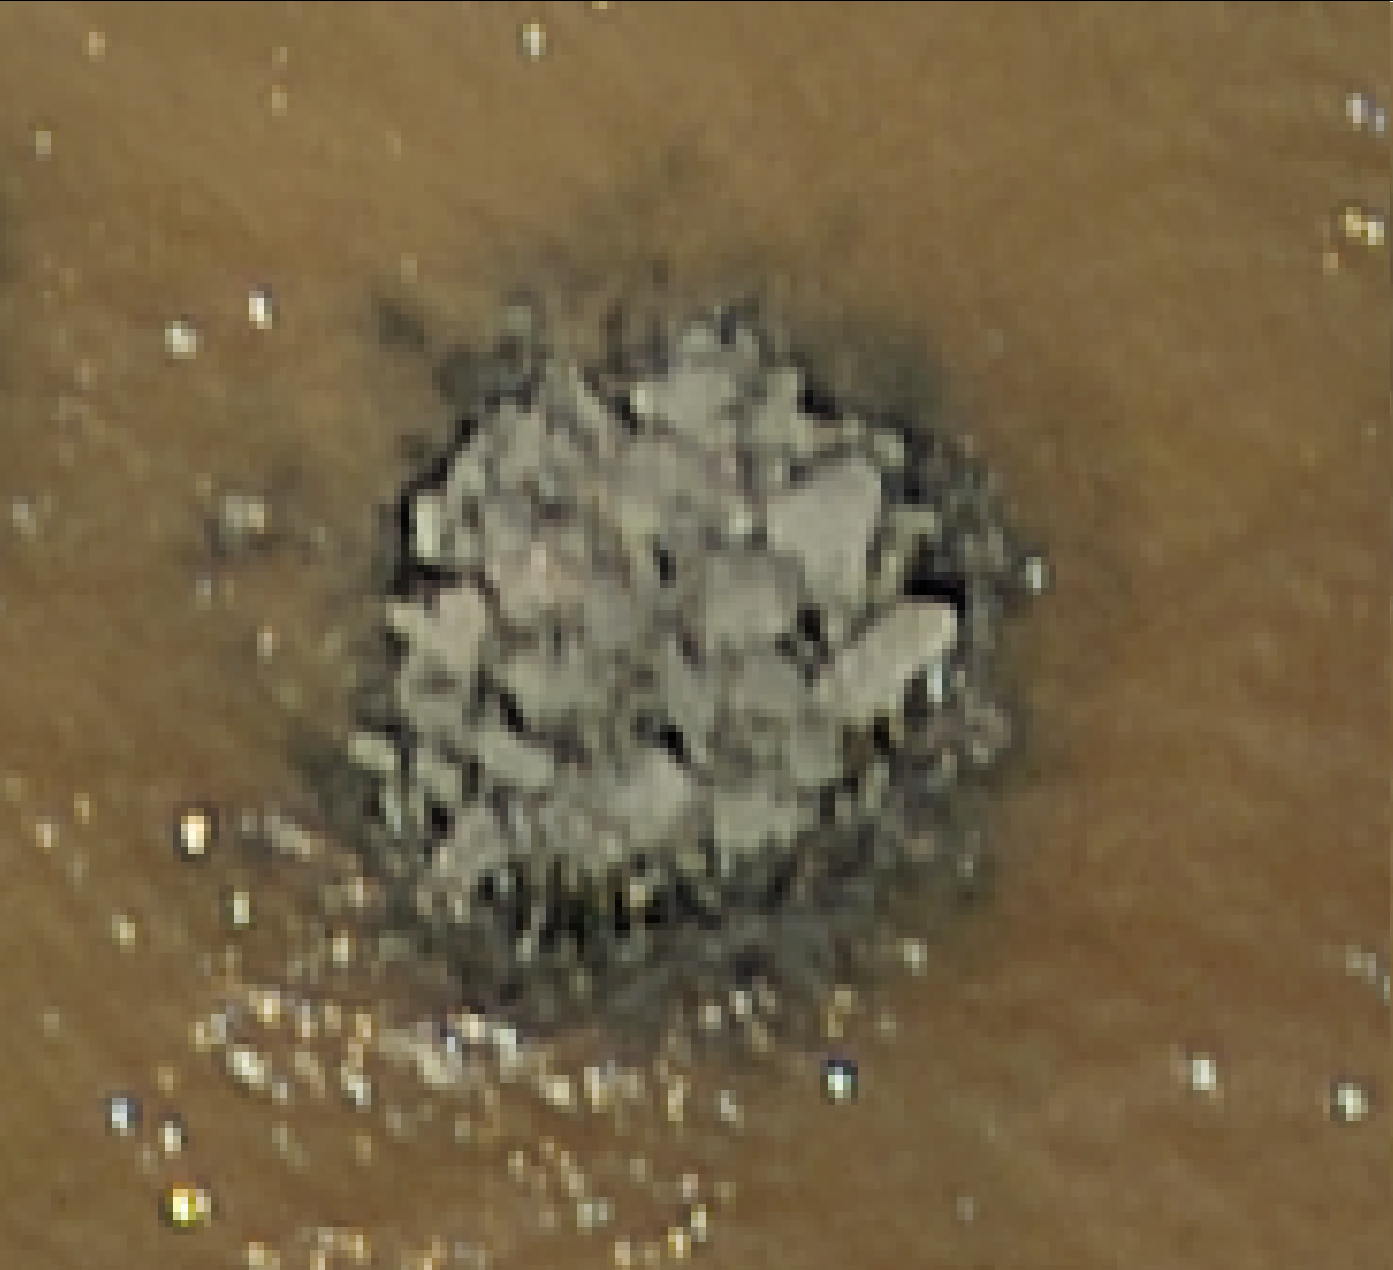
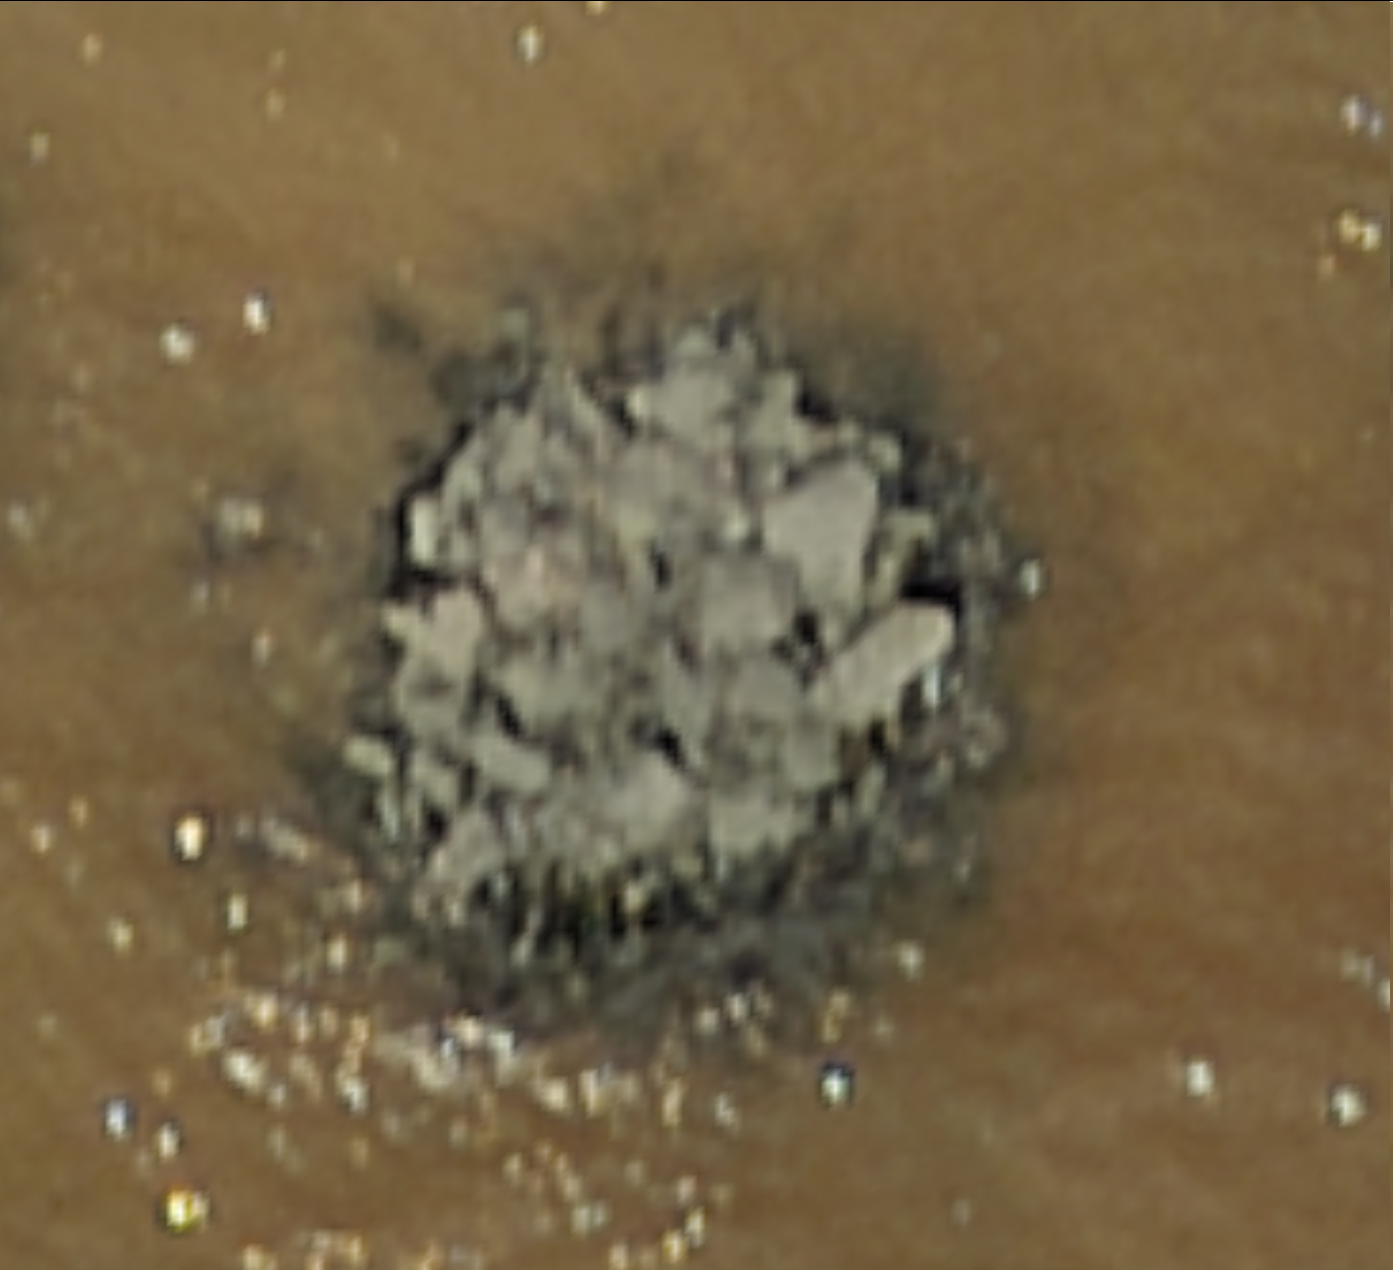
Geo-referenced images like geotiffs now let users control whether they view at the granular pixel level or with a smoothed interpolation between pixels. The previous behavior was to smoothly interpolate between pixels, however, this made it difficult to assess true georeferencing fidelity between grids and imagery derived from grids due to the smearing of object boundaries in the imported images, especially at the edges of grids. Geotiffs and other imported imagery will now default to pixel view, with the interpolation being disabled by default. The control for this is in the panel that appears at the bottom of the Project Layers dock, as shown below, when an imported geotiff is selected in the layer tree.
Here is an example of the difference between the two modes, with the new default pixel view on the left and interpolation on the right.
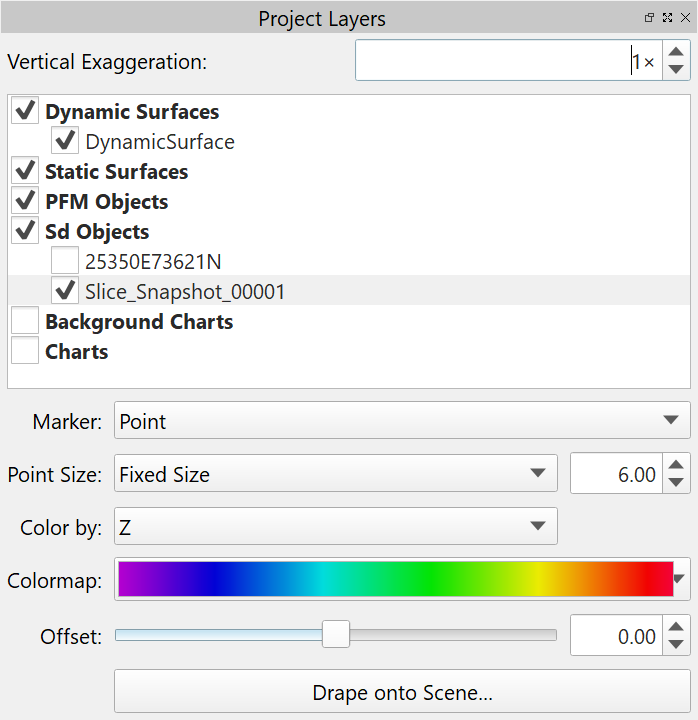
Finally, we've added the ability to adjust the color map, set the color map range and edit the color map for Point objects in .sd format. These are typically created from snapshots within Qimera (using the Swath Editor, the Slice Editor or the 3D Editor) or from importing from Fledermaus, or after importing points for visualization. An example of the change in interface is shown below. Once the Color by option is changed from Fixed Color, the Colormap selection widget will appear below the combo box that lets you chose the variable to color the points by.
Imports
Formats
Qimera is now capable of importing BSB/KAP raster nautical charts via the Import Image import pathway, which are converted to .sd format and reprojected to the project's coordinate reference system. This is done as a background task, as will be discussed further below in the Process Improvements section, to allow the user to continue to interact with the application. Note that BSB/KAP import almost always involves some reprojection, so the import can take a bit longer than usual due to the reprojection.
We have upgraded PFM support to version v6.30, this is mainly for Fledermaus FM Hydro users who still have PFM files as part of their workflow.
Qimera has supported KMALL files for quite some time and with this release we now support Kongsberg Extra Detections for KMALL. Previous versions of Qimera only supported the normal soundings from KMALL. The support for Extra Detections via Qinsy is also possible with this release due to the new Kongsberg driver in Qinsy that supports the newer Kongsberg datagram formats associated with the change to KMALL format. With the roll out of KMALL format from Kongsberg, there are quite a number of users who are using the Kongsberg convertor tool to convert KMALL to ALL files, mostly for compatibility with pre-existing software workflows. Qimera has been augmented to handle ALL file format for these kinds of systems, starting with the EM304 model. As other data files are provided to us for other models, we will add support for them as well. Previous to this augmentation, Qimera would have rejected the ALL files since the newer sensor model numbers are not recognized by Qimera as being valid for ALL format.
Process Improvements
Several improvements have been made in general to the process of importing files of different kinds into Qimera. As mentioned earlier in the section discussing BSB/KAP support, import of georeference images is now a background processing task, allowing for interaction with the application while the import, conversion and reprojection is being completed. Prior to this, the import of images was done in the main application thread and blocked interaction with the software. During our code improvements for image import, we noticed that the import process did not recall the last directory used when importing one image after, we have corrected this and now the image import will recall the last directory used after an import.
Another improvement we've made is to clarify how VERY large ASCII files should be imported. We do have some users that take delivery of ASCII files where the data from many survey lines is delivered as a single ASCII file. These files are sometimes several tens of GBs. There is a special import procedure for these types of files that will break it up into several QPD files, but such users would sometimes accidentally try to import these files using the standard ASCII import procedure, causing instabilities and sometimes crashes in Qimera. To remedy this, we've made the special import tool more prominent on the import menu: users will now see an entry for "Import Large ASCII Processed Point File...". Furthermore, if users still miss this and accidentally import using the standard processed point import routine, Qimera will now warn users that they should instead use the Large ASCII file import option. Import of ASCII where one file is typically associated with one single survey line should follow the standard ASCII import procedure.
Lastly, along the line of improving how data can be imported into Qimera, we've upgraded Qimera Live to more elegantly handle multi-object setups in Qinsy. In this new release, Qimera Live now does not prompt for user input to append to the Dynamic Surface after each file when importing multi-object .db files from Qinsy. Previously, each imported file for a multi-object setup was launching a dialog that required user intervention. This was undermining the goal of Qimera Live, which is to automatically import, process and grid data without user intervention.
Exports
New Formats
We have two new export formats with this release. You can now export Dynamic Surfaces and Static Surfaces as a Google Earth KML and as a 3D PDF. These are export formats that were available in Fledermaus and this tech has been ported to Qimera, another example of our continual alignment of capabilities across our product line. We have a roadmap in mind for this particular topic and we are paying special attention to the Feedback Projects for each application to see what common formats users are seeking to have available.
Improvements to GSF Export
We've made two changes to how GSF data is exported. GSF exports for R2Sonic data now have a better correction for the z-offset between transmitter and receiver for the purpose of backscatter snippet imagery coregistration with the bottom detect. Previously, this was hardcoded with the 2024 sensor offsets as default and now the z-offset is read directly from the R2Sonic datagram. This improvement has no effect whatsoever on the bathymetry, it only affects the metadata associated with the snippet imagery, particularly the determination of which snippet sample number corresponds to the bottom detection. This improvement will lead to better backscatter imagery in the nadir region for FMGT users. The same correction has been made in the FMGT code base and this will be released and available to users shortly after the Qimera 2 release.
Another change we've made is that GSF exports now only include the motion sensor data that falls within the time span of the bathymetry pings in the file. Previous versions would include the entire time-span of the sensor data stream, which was a problem with data that was merged with external navigation/motion files like SBET, since the entire SBET motion data set was included in the GSF. This would dramatically increase the size of exported GSF files. This is now fixed.
Miscellaneous
There has been some small clean up for all the export functions in that they will now all export by default to the project's export subdirectory. There were a few cases where this was not the case, for example, the export of .sd objects to line files. Further along this line, export of BAG and BBH files will now use the Dynamic Surface's name as the default filename. Previously, they were using a default export filename which the user then had to rename.
The ASCII export function from the time-series editor has been improved to allow control over whether or not rejected samples were included in the export. The sample status (accepted or rejected) is now included in the exported file as well.
Miscellaneous Small Improvements
Keyboard shortcuts
- Keyboard shortcuts now recognize number pad keys as distinct keys
- The Time-Series Editor now has a Ctrl-Z keyboard shortcut for undo
Labeling, text, display
- Improved help text for Vertical Referencing "Static Offset" to improve user understanding
- Consistent and correct use of CoG and COG throughout application: CoG is meant for Centre-of-Gravity, whereas as COG is meant to represent Course-Over-Ground. There were some instances where these were incorrect.
- Omniviewer now shows horizontal and vertical uncertainty (95% c.l.), previously it showed horizontal and vertical variance
Processing and Analysis
- Improved navigation resolution preservation throughout processing for sub-cm positioning consistency
- External navigation lines colored differently than raw/processed point files when drawn in the Scene to help differentiate visually between the two
- Cross check reporting tool can be saved as a report with graphics and statistics
- Cross check tool export of results to ASCII has more friendly and readable output
- Multi-spectral
- The Datagram Viewer tool will now report sonar frequency to ease identification of sonar frequencies, for multi-spectral backscatter workflows
- Frequency filter for multi-spectral backscatter workflows is now less sensitive to numeric precision of user input
- "Select by Frequency" filter now works on GSF files with R2Sonic data. Previously this would only work for Qinsy .db files.
