How-to Flag Grid Cells
This How-to document describes how to use the Flag Grid Cells tool and how the result can be visualized to aid in data control.
Introduction
The Flag Grid Cells tool allows users to set indicators for which a grid cell will be flagged. The user does this by choosing a mode and then defining the indicators that the algorithm needs to use. An additional option is to populate a list for which cells are flagged which can be exported and visualized for rapid data verification.
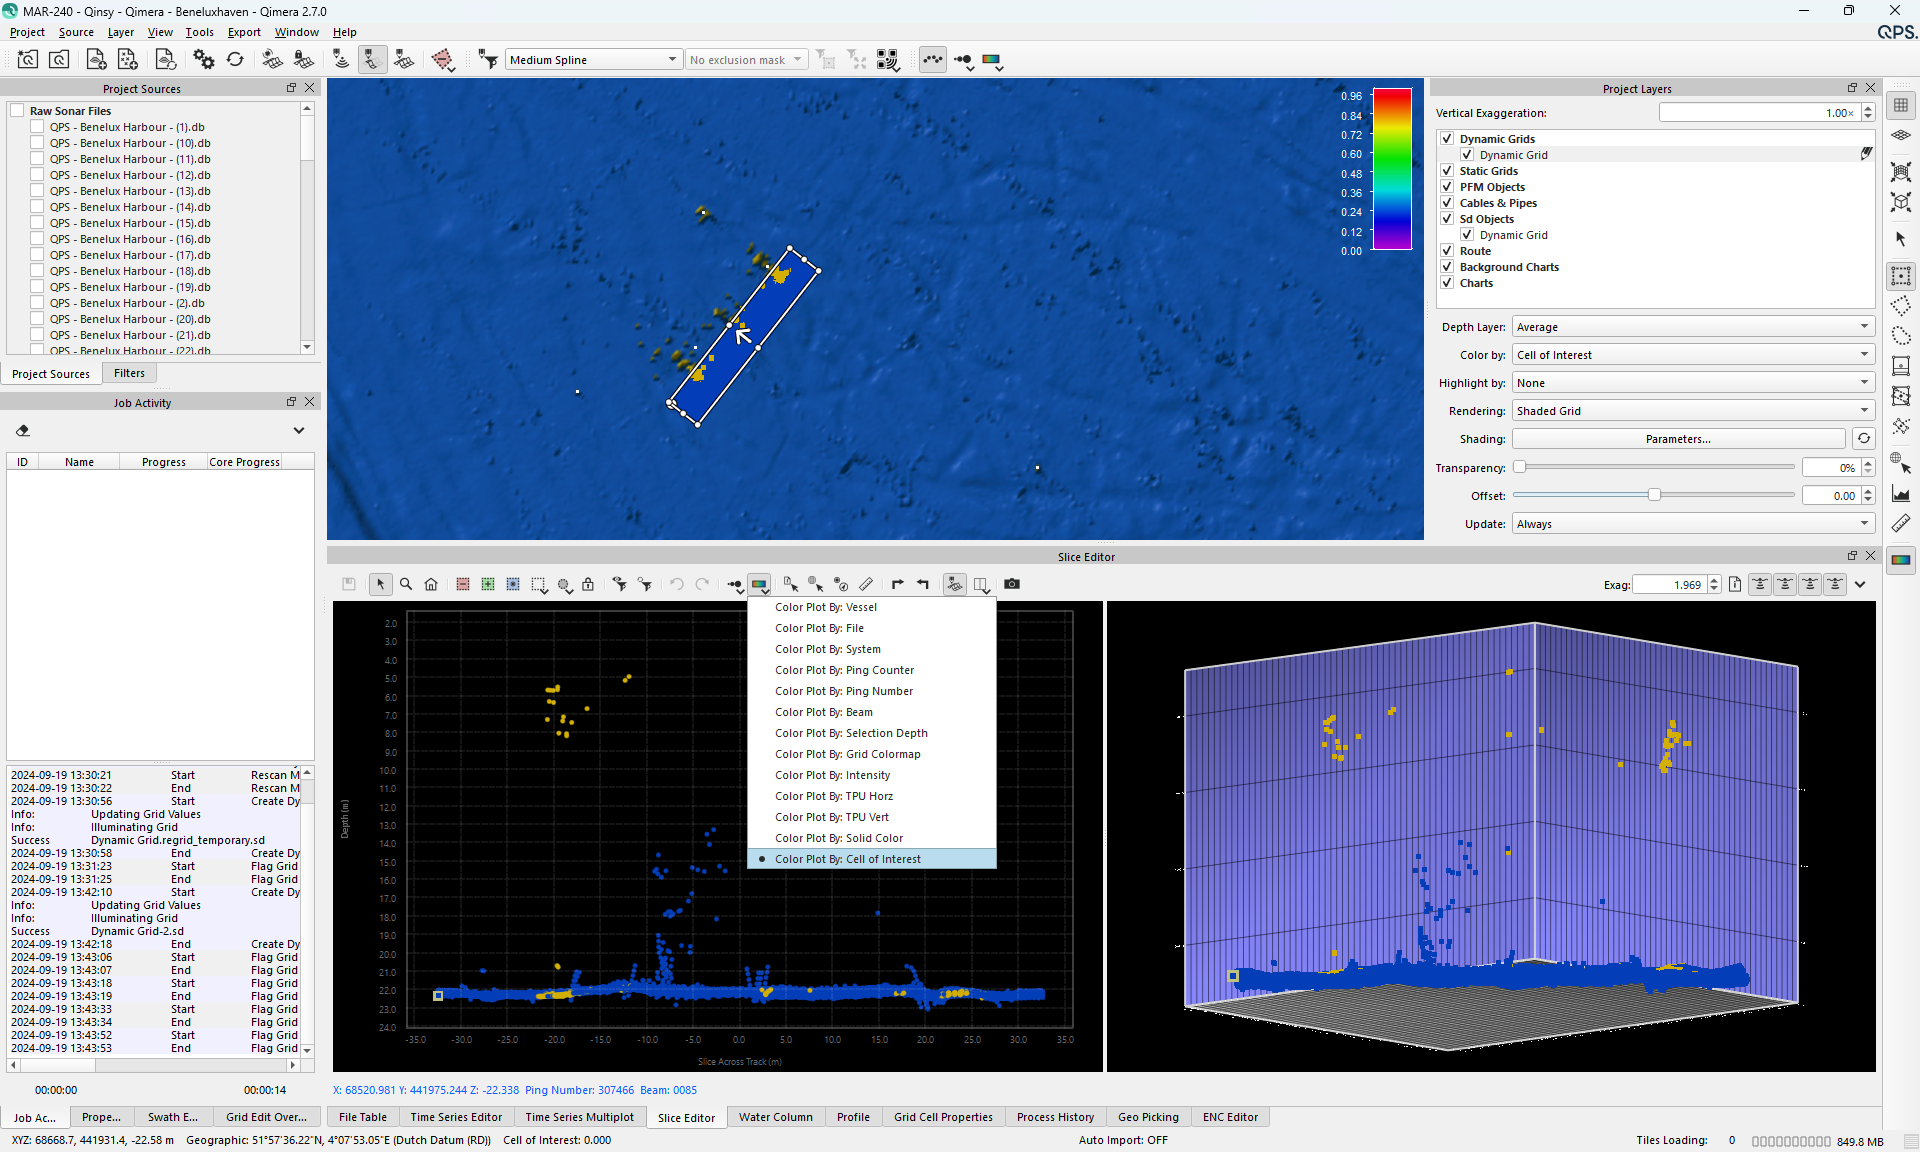
After the tool has been run, the option to color your grid on “Cell of interest” allow to identify areas which are marked by the tool. When the slice editor is used the option color by “Cell of interest” will show the user which sounding contributed to the marked grid cell.
Step-by-step-guide
Step 1 - Start the Flag Grid Cell tool
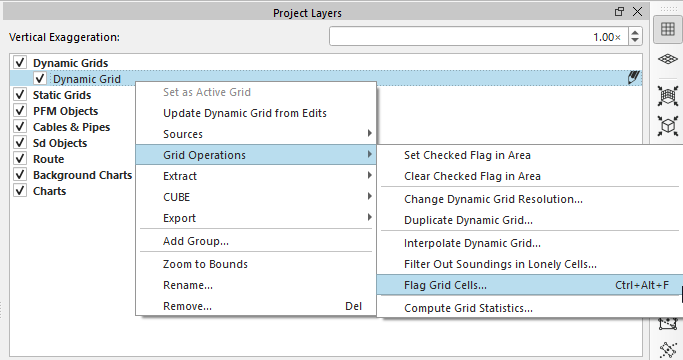
Right-click on a Dynamic Grid, Grid Operation, and Flag Grid Cells. You can also use the shortcut ctrl + alt + f.
Step 2 - Run the tool
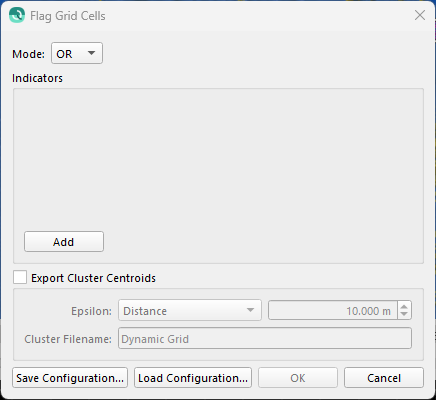
Mode
Set to AND if all indicators must be true for a cell to be flagged. Set to OR if just one of the indicators must be true for a cell to be flagged.
Indicators
Indicators are the conditions that must be satisfied for a cell to be flagged. To add a new indicator, click the add button and update the desired layer, algorithm and range. These can later be removed using the 'X'.
Settings | Option | Description |
|---|---|---|
Layer | Cell Range | Option to set a layer type to flag the grid cells that are true for that layer. For exmaple: Set the option to Density - Less Than - 10 to flag all the cells that have a sounding density less than 10 in that cell. |
Algorithm | Greater Than | Used to define an expression for which the algortihm should use the values set in the settings option. |
Settings | Min or Max Value | Based on the set alogrithm the option to set a min and or max value is available. |
Export Cluster Centroids
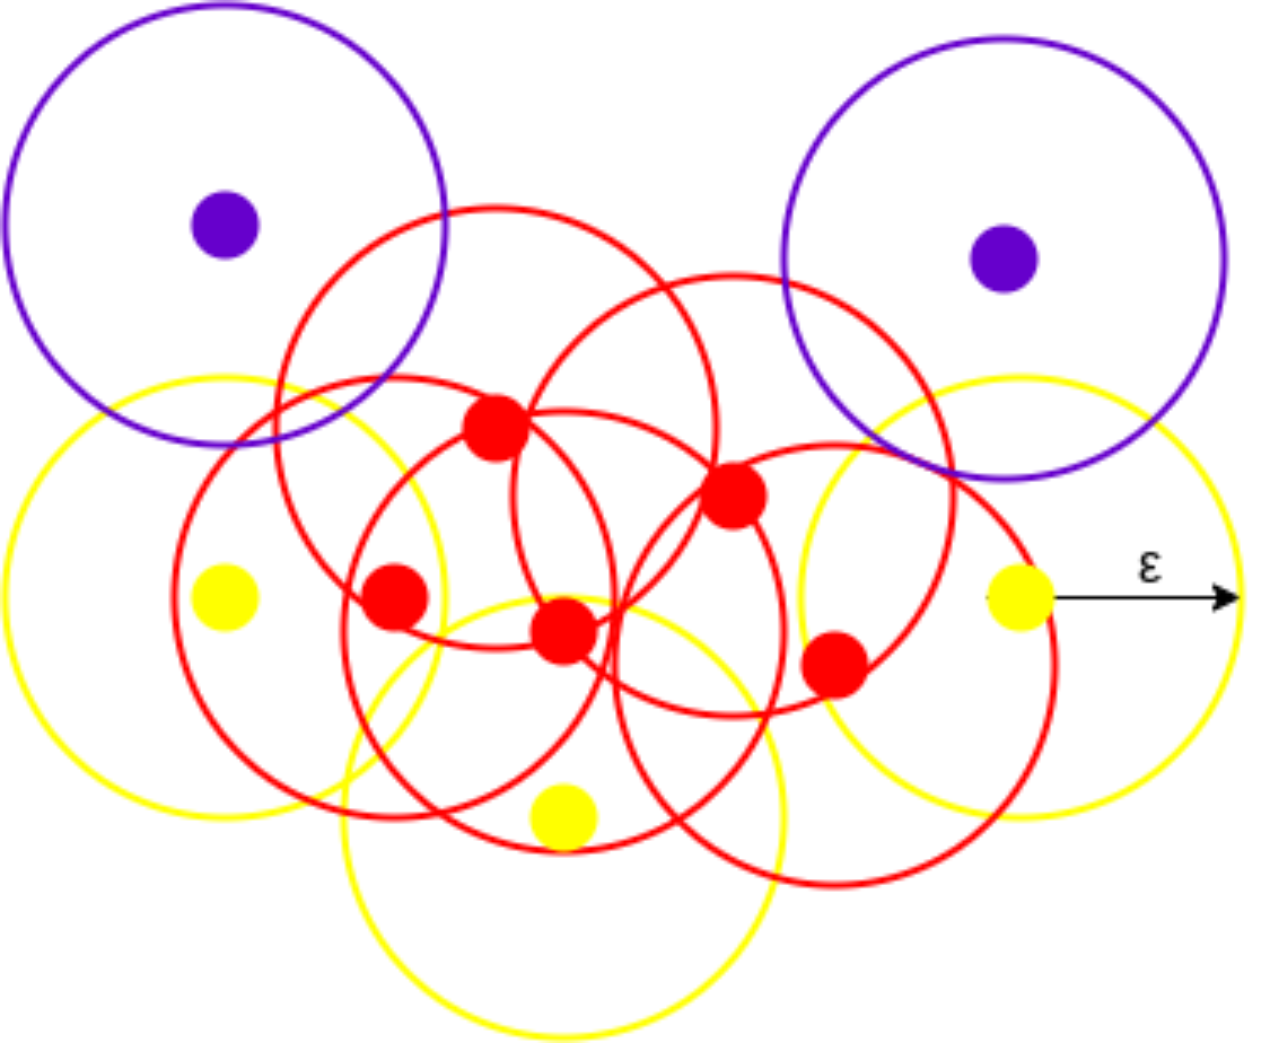
Checking export cluster centroids will perform a clustering algorithm and produce a points object that can be used to geolocate groups of flagged cells. The epsilon parameter can be used to define the maximum distance between two samples for them to be considered in the same group.
When multiple cells are within the same epsilon range they are considered 1 group. If points are outside of this group they are considered a different group.
The file name defines the points object's name that will be automatically added to the project when the operation is complete.
Step 3 - Assess the flagged cells
After the tool has been run there are multiple options to assess the flagged cells. Users can use the file populated by the Export Cluster Centroids for an overview and quick navigation option to go to the specific cells when it is loaded in the Geo Picking dock. This can then be used in combination with the option to color a grid by “Cell of interest”.
File list
The list that is generated with the “Export Cluster Centroids” is automatically loaded in the “Project Layers” dock underneath the “Sd Objects”. Selecting this list gives user the option to adjust the markers, size and color for better visualization purposes if desired.
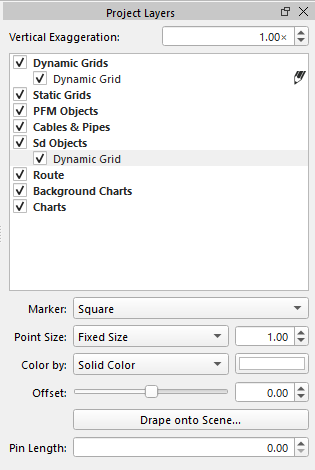
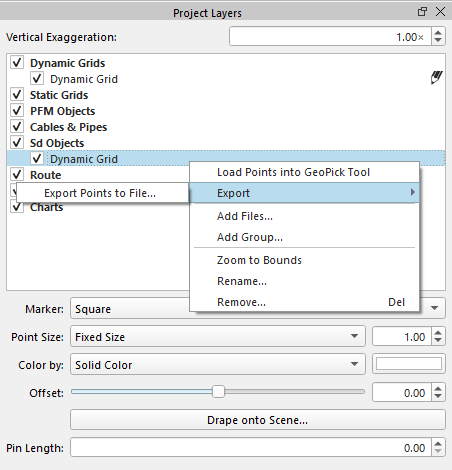
The entire list can be exported to an XYZ file and also be loaded in the Geopicking dock for overview and quick navigation to marked areas of interest.
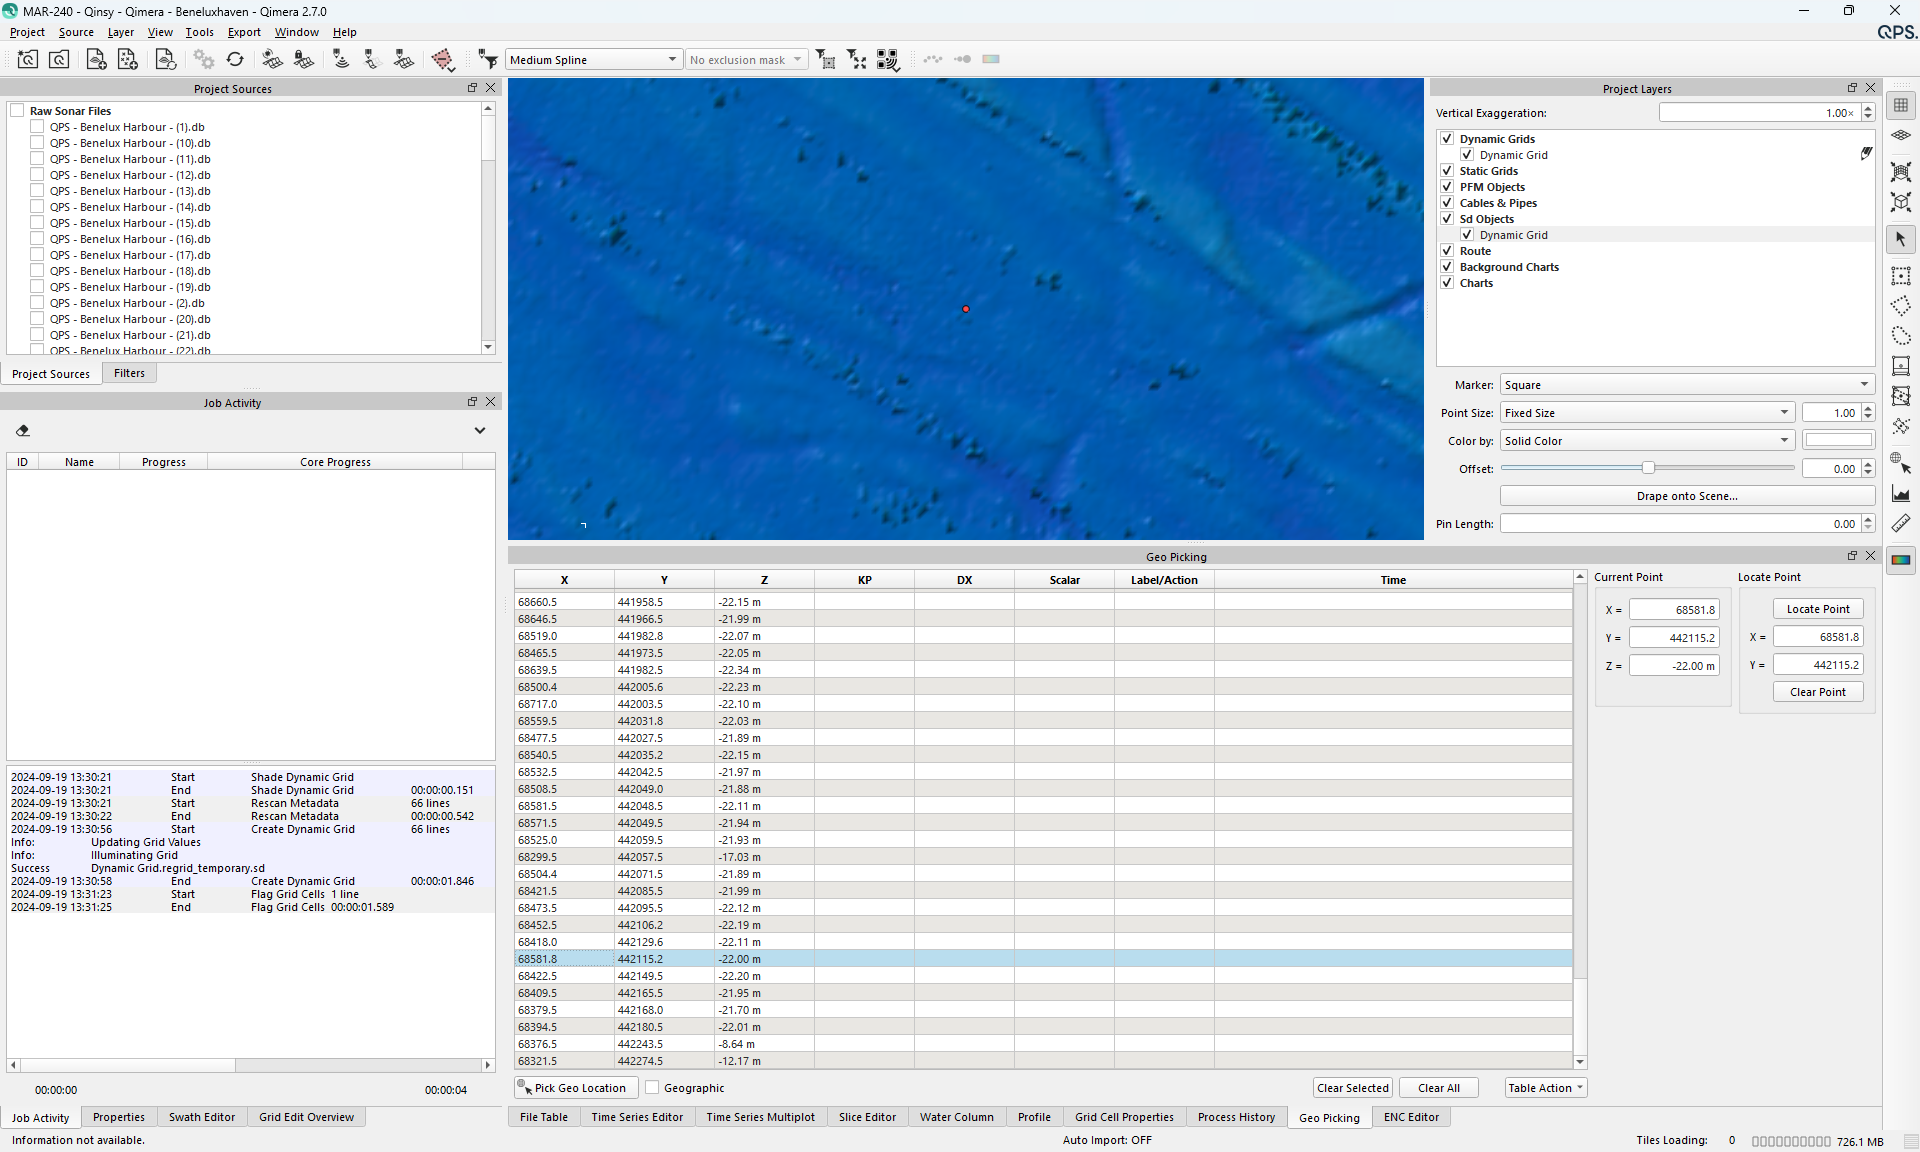
When the points are loaded in the Geopicking dock, users can select a point and use the “Locate Point” to move the general view to that point. This will help in finding areas of interest that are marked with the Flag Grid Cell tools on a larger data set.
Dynamic Grid Color by
When the tool has been run the user can use the Color by “Cell of interest” option on the Dynamic Grid that was used. This will color the cells that are flagged “yellow” and the other cells blue for a distinguish color and easy identification of cells or interest.
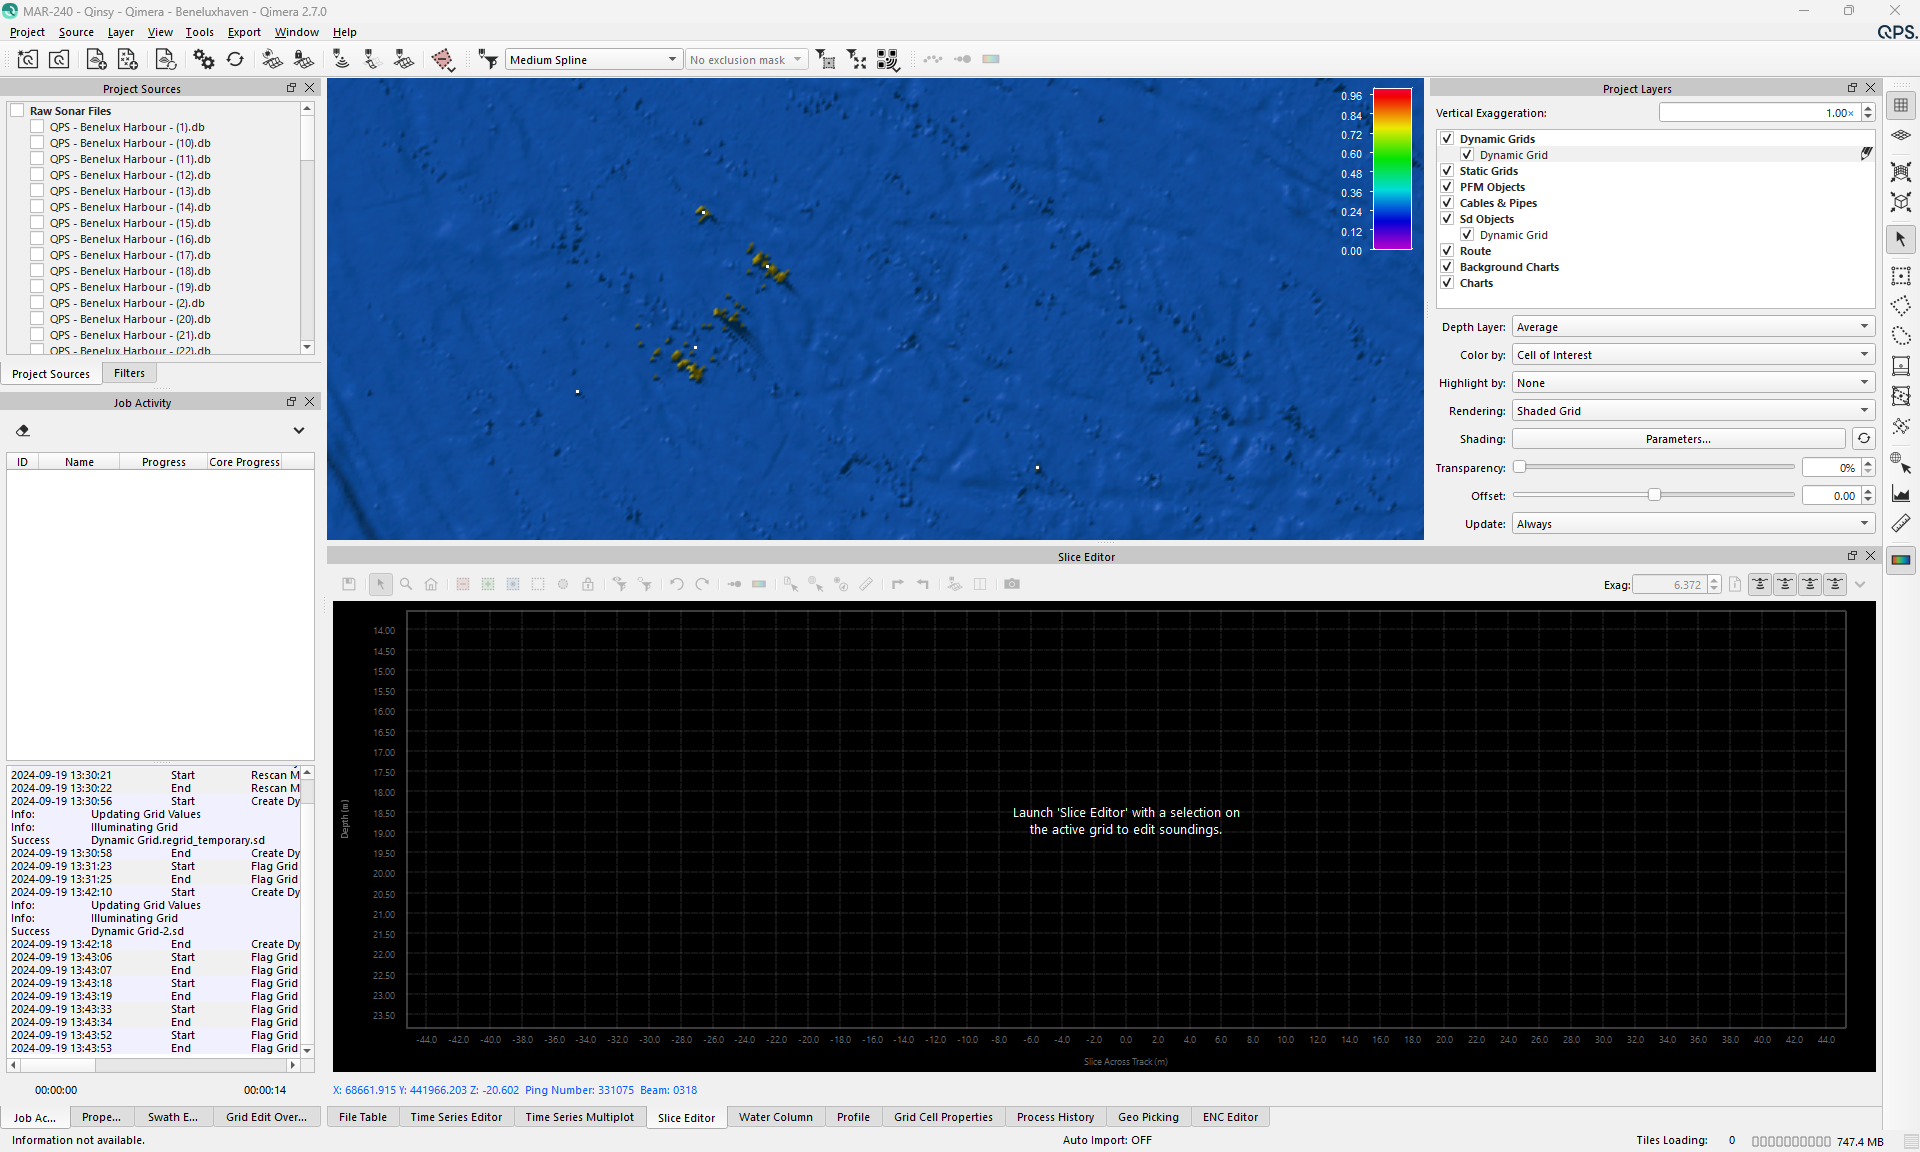
Slice Editor Color by
When cells of interest are marked a user can decide to investigate further for example, if the cells are flagged with a high Uncertainty(95%) or outside of a Cell Range. When a selection is made on the area the slice editor can be launched. In the slice editor the Color by “Cell of interest” option to show which soundings contributed to the flagging of the grid cells and decide what actions needs to be done.
