How-to Coverage Extinction Plot
This page goes into how to use the plot and some advantages of using it.
On this page:
What is it?
The coverage extinction plot in Qimera is a tool that lets you assess the swath coverage capabilities of your multibeam system. This page goes into how to use the plot and some advantages of using it.
How to use it?
How to access
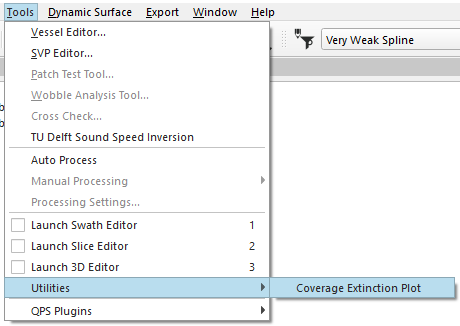
To start the tool, navigate to the Coverage Extinction Plot option from Tools->Utilities menu of Main Menu bar.

Data Used and Advantages
Data to effectively utilize this plot usually consists of a set of survey lines running from the shallowest to the deepest depth range of the system. This is not always necessary, however data as aforementioned allows the user to determine where the coverage decreases, and at what ranges the sonar is actually effective to.
Advantages to ensuring your data can be used in this tool include:
- the ability to determine the swath coverage of your system (relative to the manufacturer's claimed specifications)
- noise issues that arise due to interference (from mechanical, electrical, or acoustic sources) can be identified early on
- this plot can be used to assess and diagnose system health (examples of using this type of plot for this reason can be seen in the technical reports produced by the Multibeam Advisory Committee (MAC) on their website, http://mac.unols.org/reports )
- As with all Qimera plotting widgets, the graph can be saved as a report quality PNG file with full markup of axes, etc.
Example
Here is an image displaying an example of the type of plot you get from using this tool:

The image above repeats the analysis of a Kongsberg EM710 data set done by the MAC during a sea trial aboard the R/V Falkor (look for the 2014 Spring report on this at the link above, specifically page 18). Here are some key things to notice about this plot:
- The graph indicates that the EM710 achieved maximum swath width at a depth of about 500-600 m, which is within expectation.
- Full extinction occurred near 2,000 m, which was also expected.
For more information on this tool, please visit our reference manual: Qimera Coverage Extinction Plot
