Annotations
Introduction
Annotations in Qastor provide an additional layer of information that enhances the user experience. These annotations can take the form of points, lines, or areas, and can include supplementary attachments such as text or graphics.
The GeoJSON file format is utilized for these annotations, offering a widely accepted method that allows for easy importing, generation, and editing within Qastor.
You can customize your annotations with the following properties:
Name Displayed in the chart
Icon: Add a vector icon shown in Qastor
Color: Choose a color for visibility
Transparency: Adjust the transparency level
Zoom Level: Control the visibility of annotations based on zoom level similar to (SCAle to MINimum or SCAMIN) used for ENC`s.
Attachments: Include additional text or graphics files.
Alarms: Set alerts for your own or other vessels entering an annotation area
Generation of Annotations
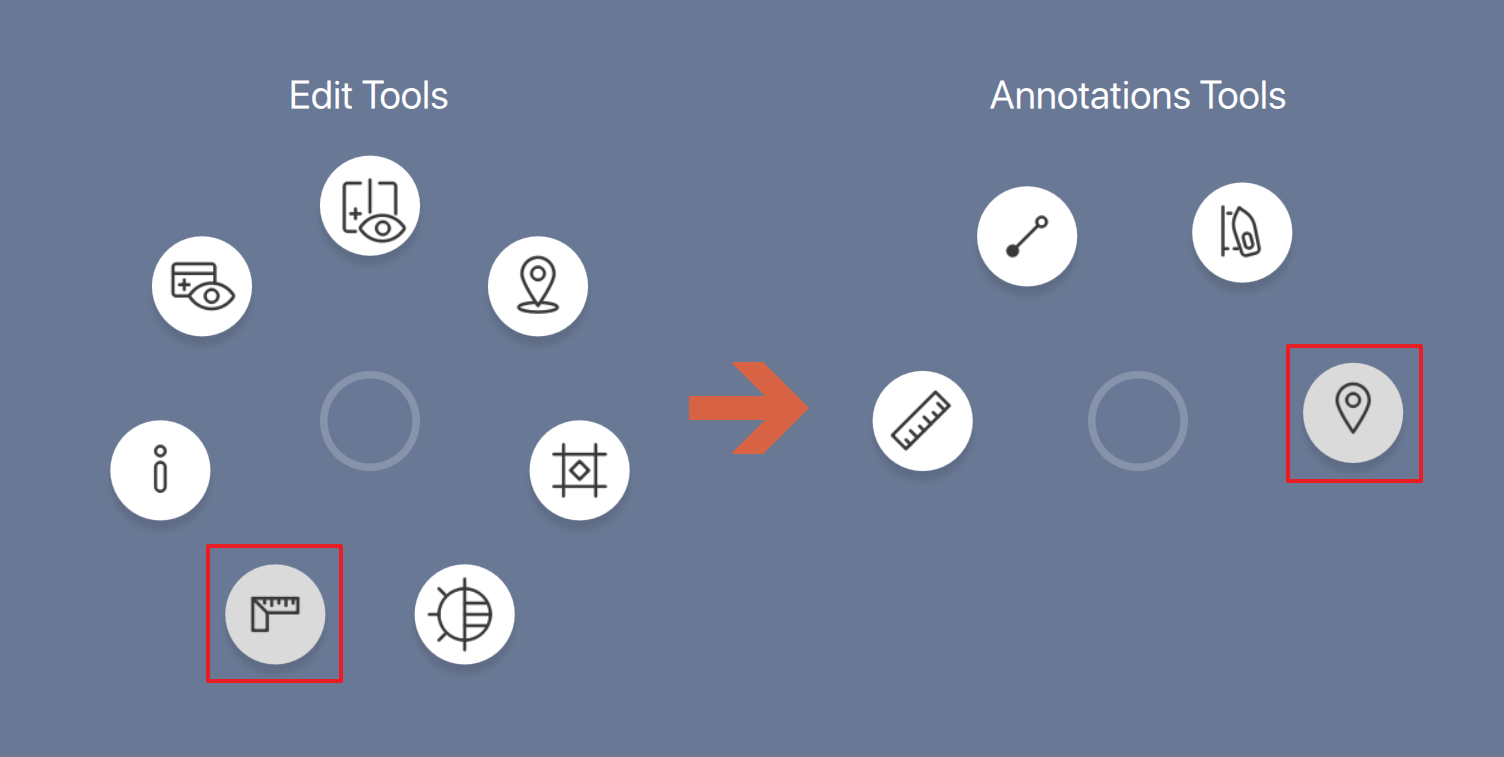
Long press/right mouse click anywhere in the Qastor display to open a chart radial menu and select Edit tools > Annotations Tools
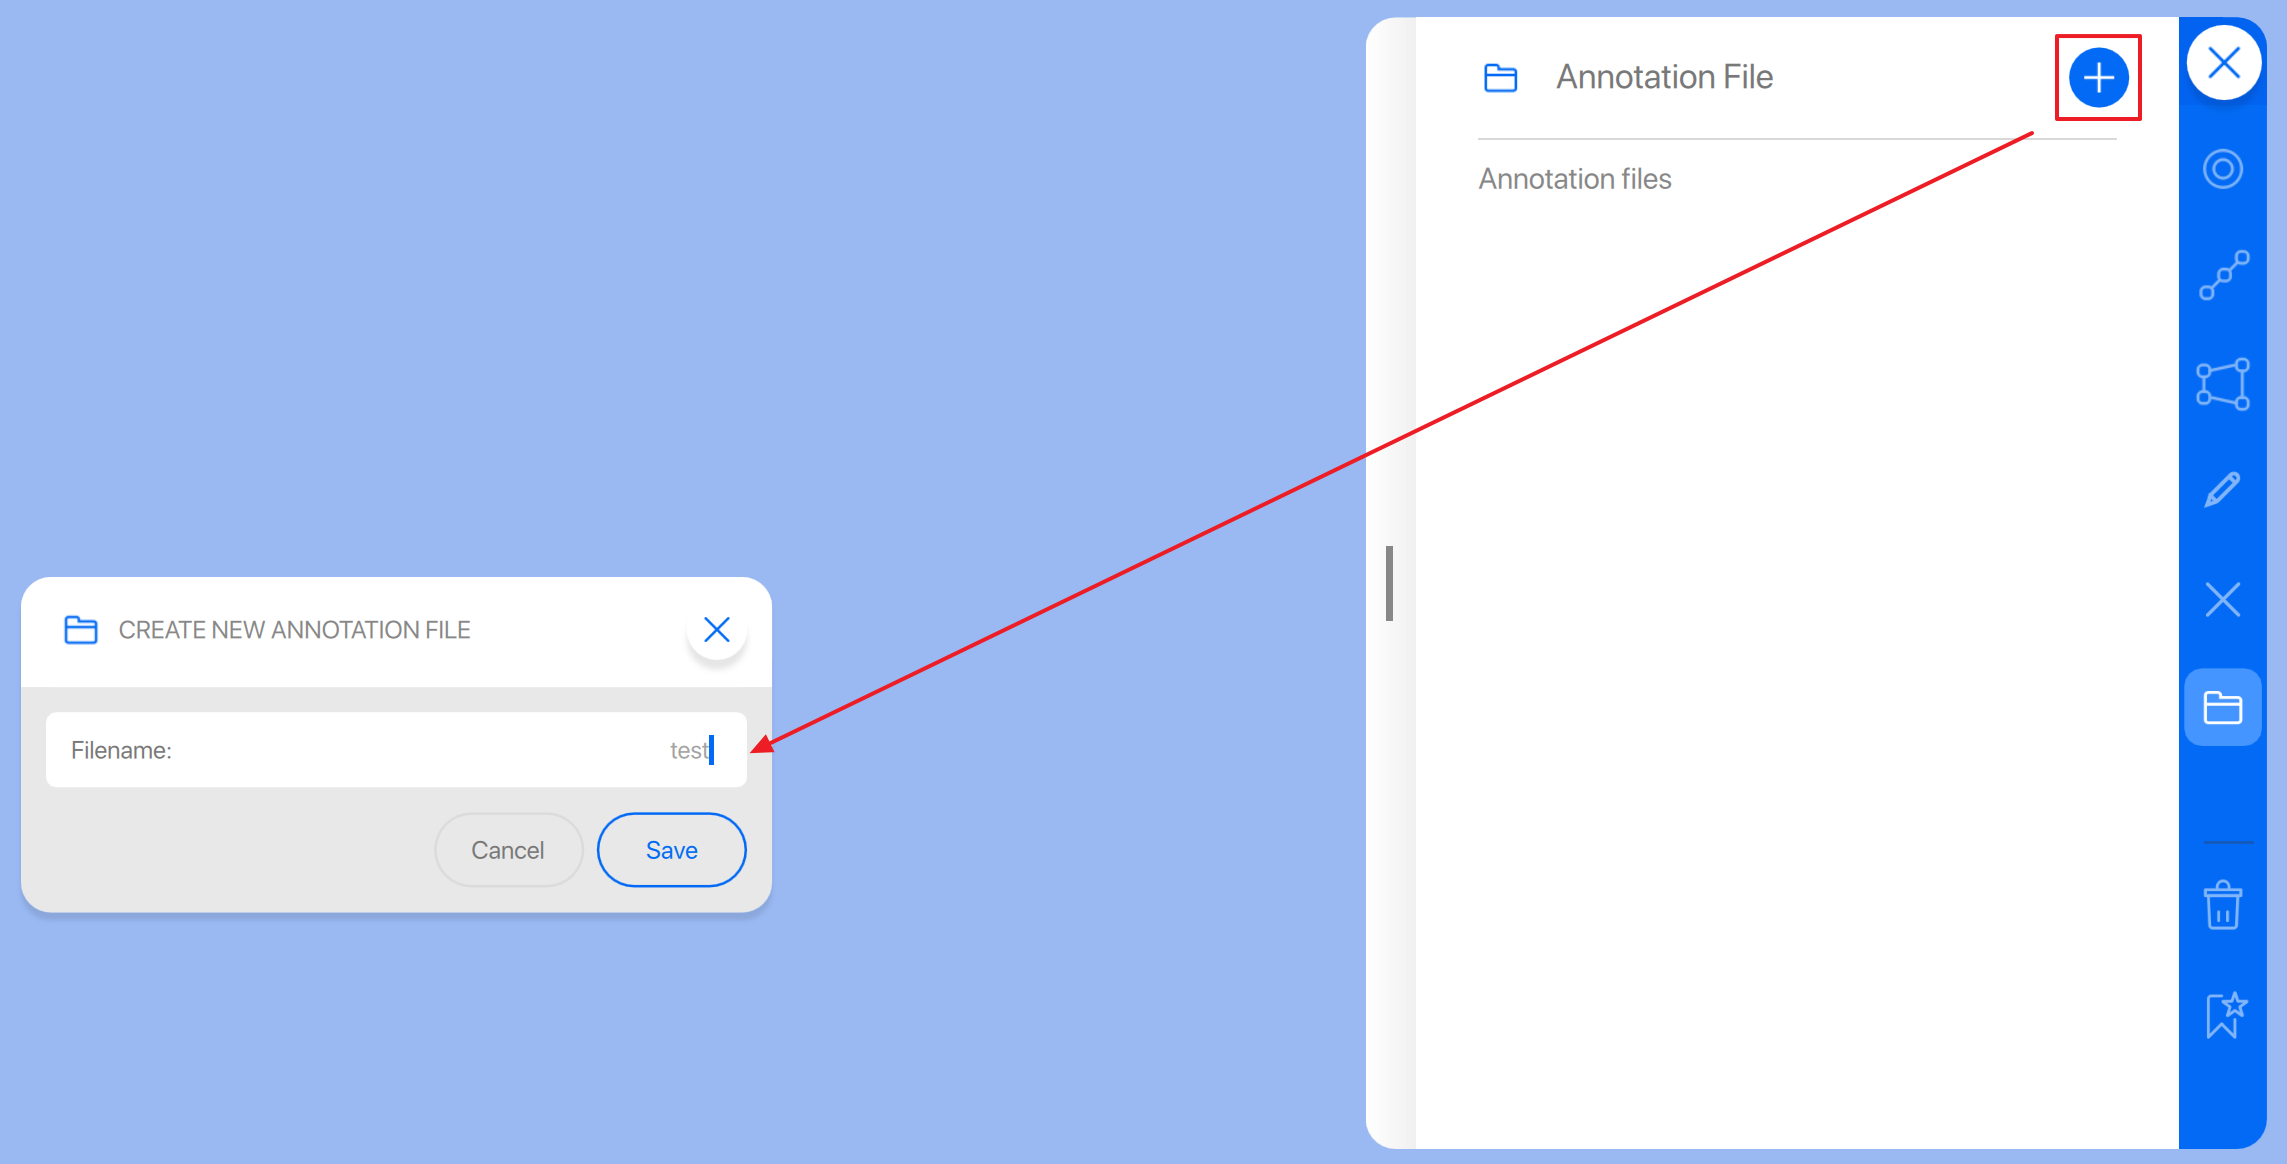
In the now opened menu you can generate a new annotation file with the “+” icon in the top right corner, provide a name and Save the annotation file.
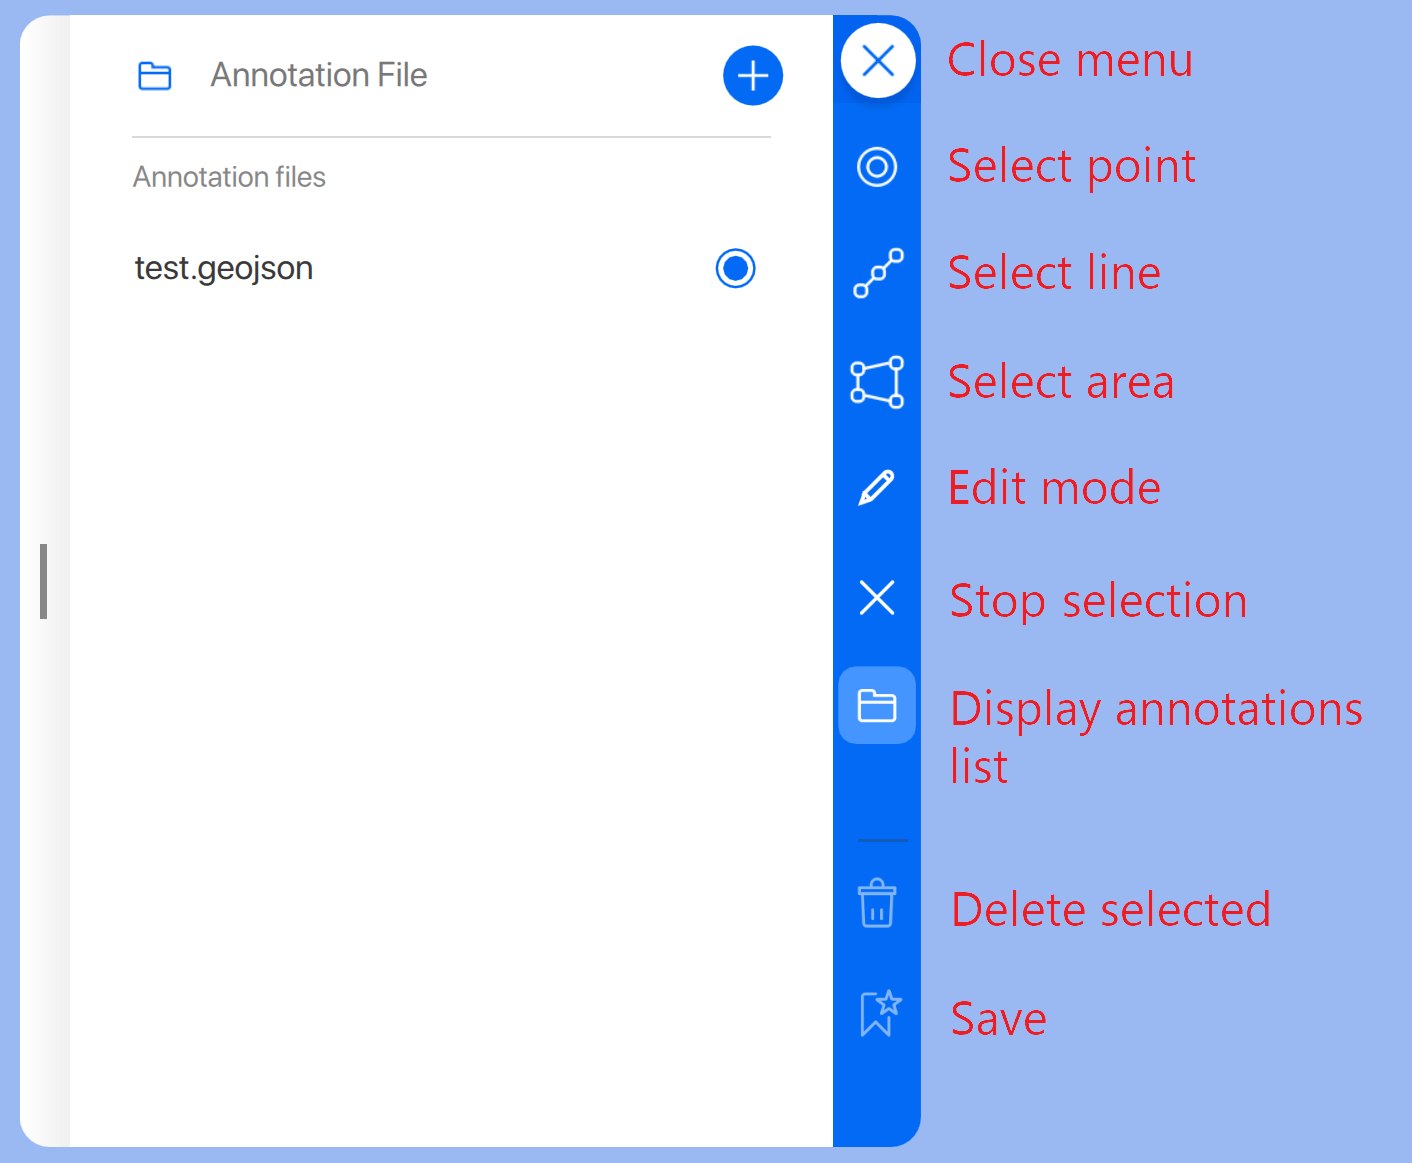
It is now possible to add annotation points, lines and areas to this newly created annotation file.
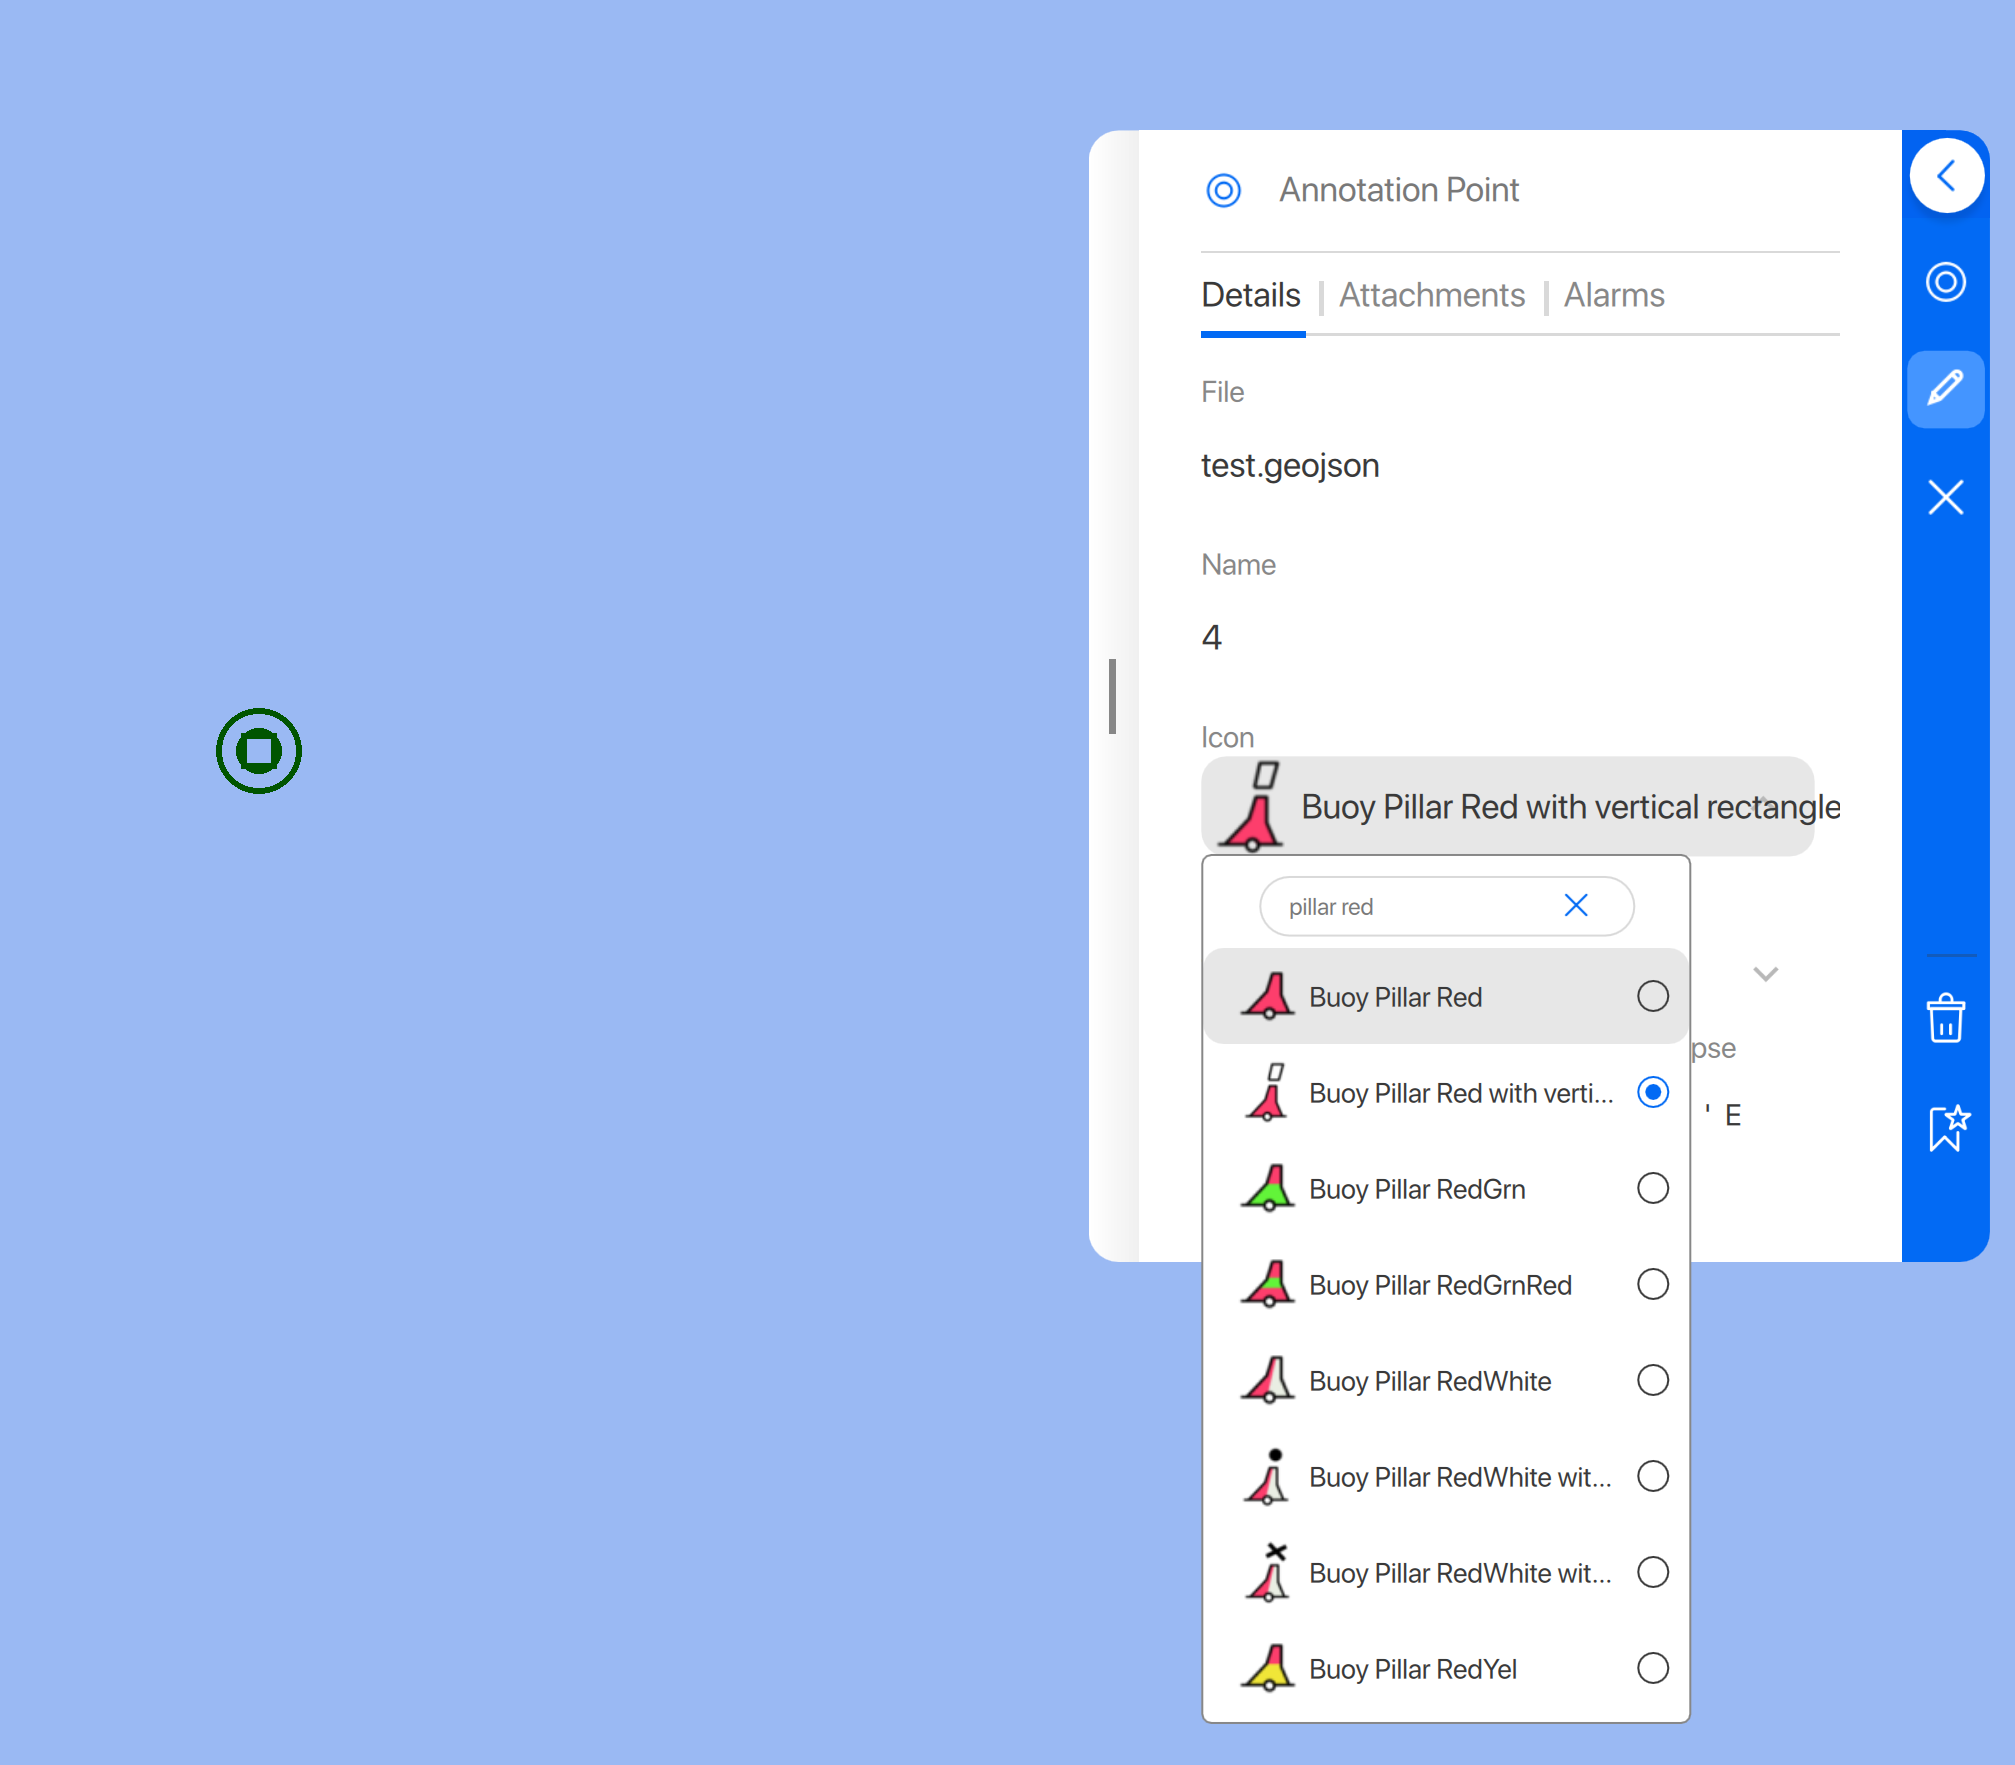
Points
Select point icon in the blue menu bar and place the cursor or tap on a position in the chart to generate a new point. Use Save icon at the bottom to store.
Lines
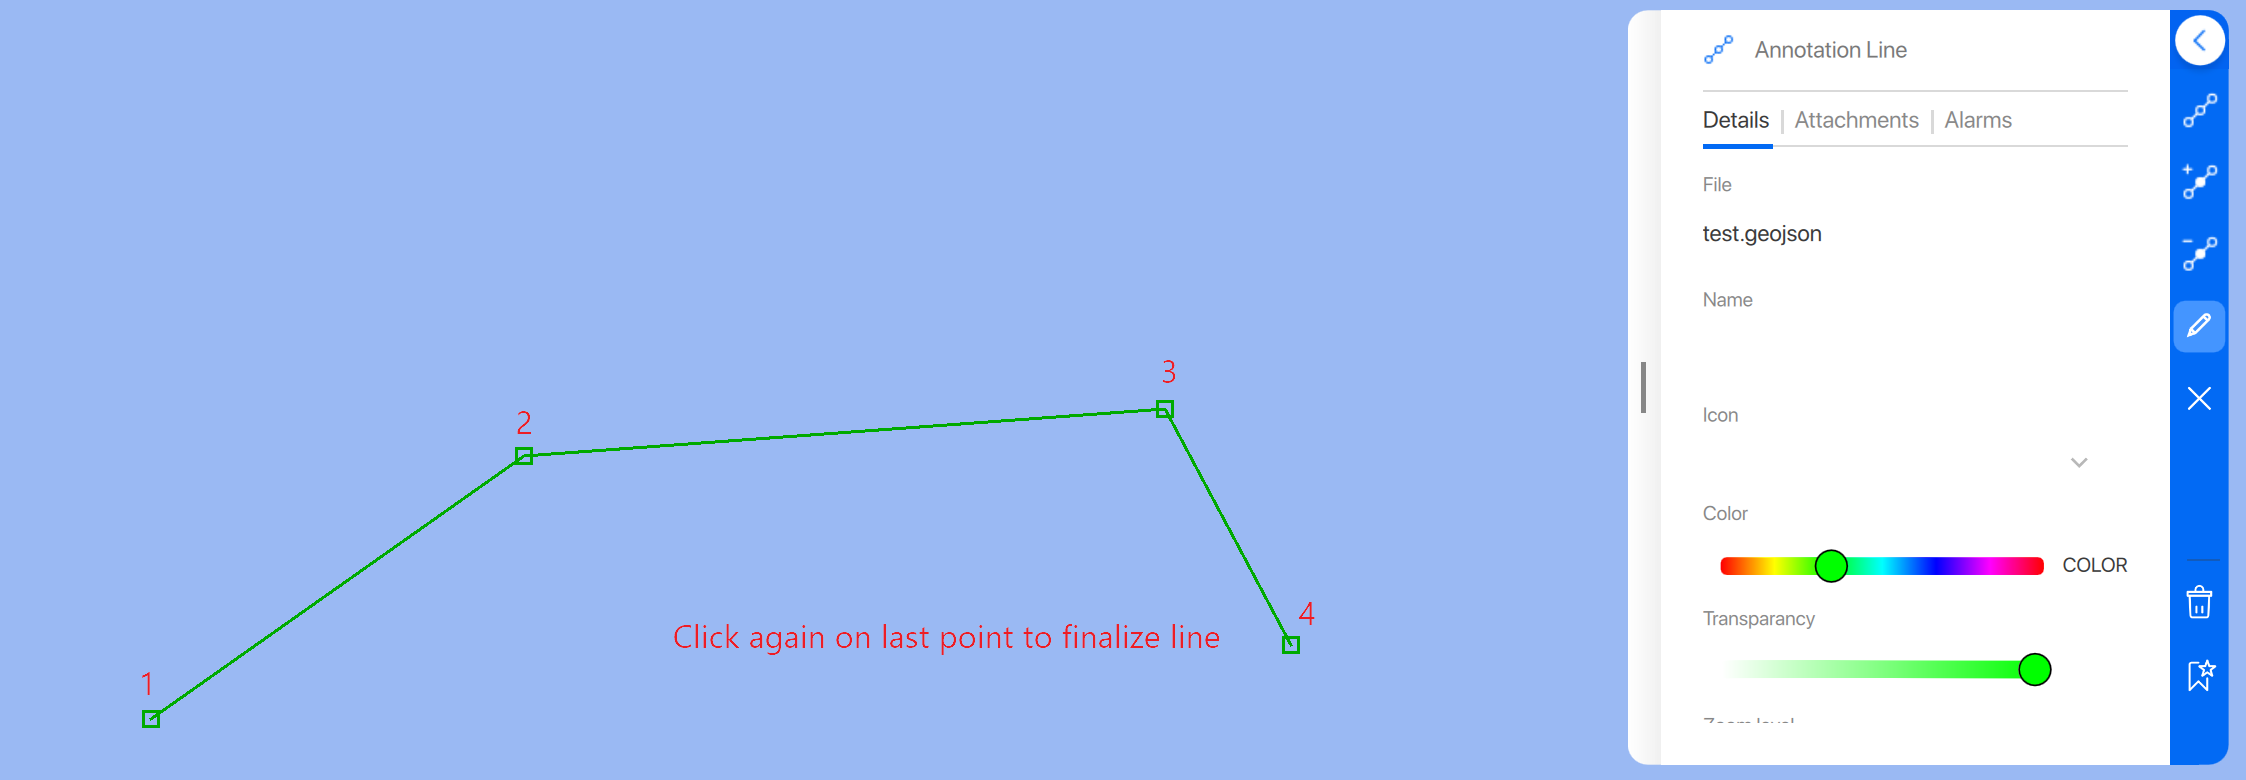
Select line from the start menu and set points in the chart by clicking on the position in the chart. You can finalize a line by clicking again on the last point in the generated line.
Similar to points you can add details like name, add an icon, color transparency, zoom level and adjust the positions of the points in the line manually by typing in the coordinates or long press on a point and drag it to a different position in the chart.
Areas
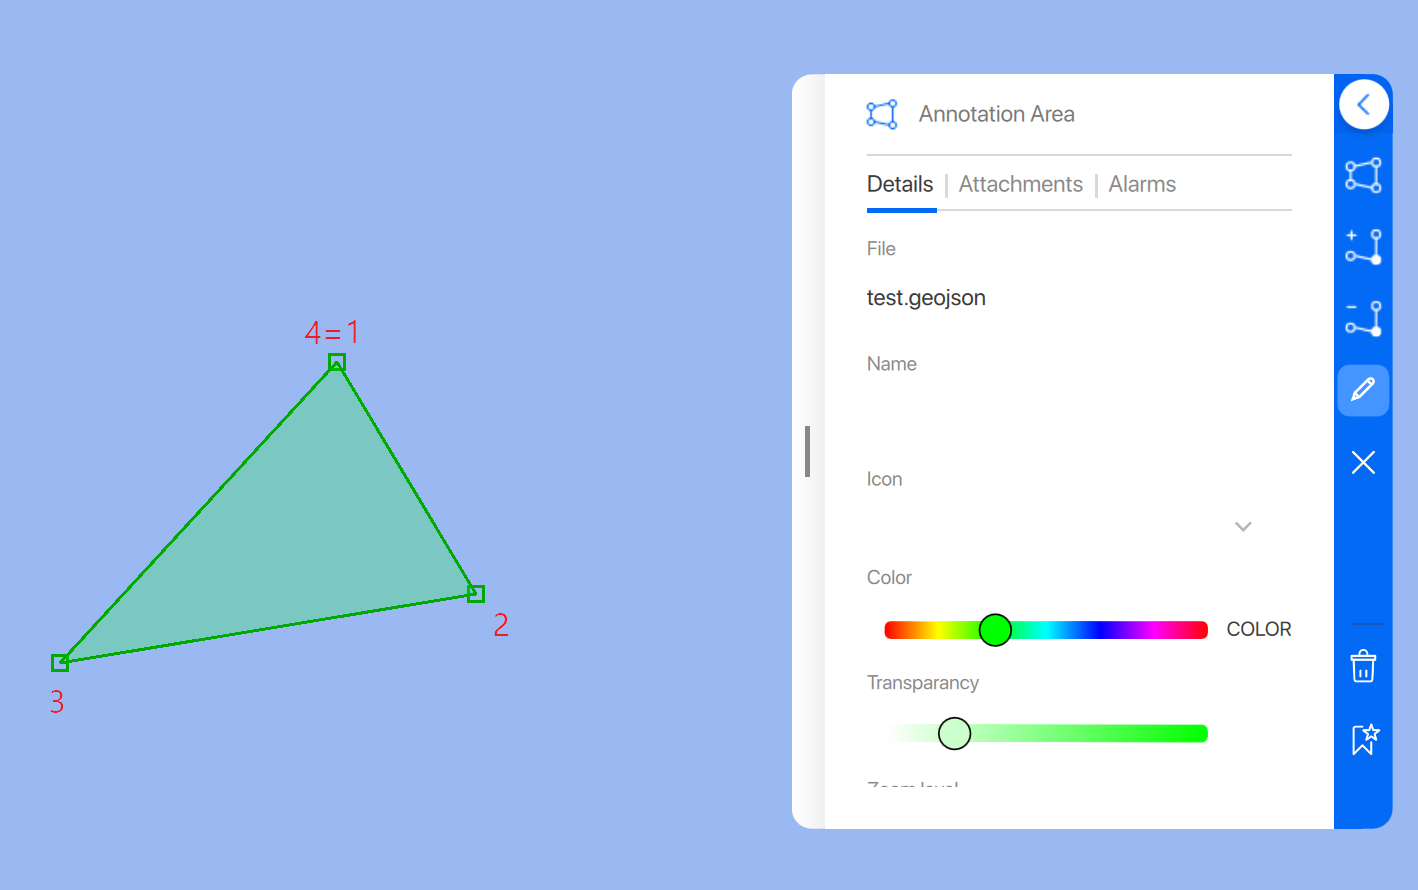
Select the area icon from the annotations start menu to generate a new area. An area should consist of at least three different points. You can finalize an area by closing the edge combining the last point with the first point. The same attributes as points and lines can be set like name, icon, color, transparency and zoom level.
Edit existing annotation
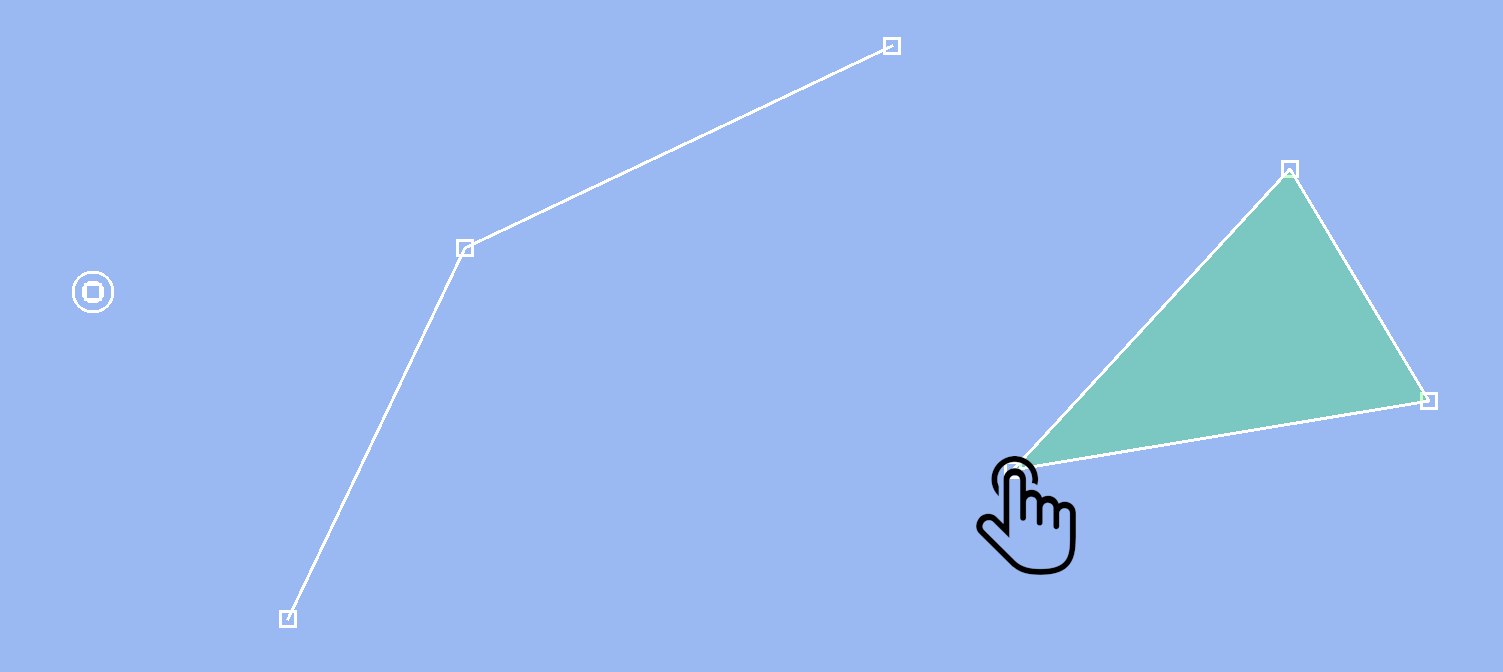
While in edit mode you can long press and hold on a point, point of a line or area until it changes to a white colored item to adjust it`s position by dragging it. You can also add the coordinates in the bottom part of the Details section.
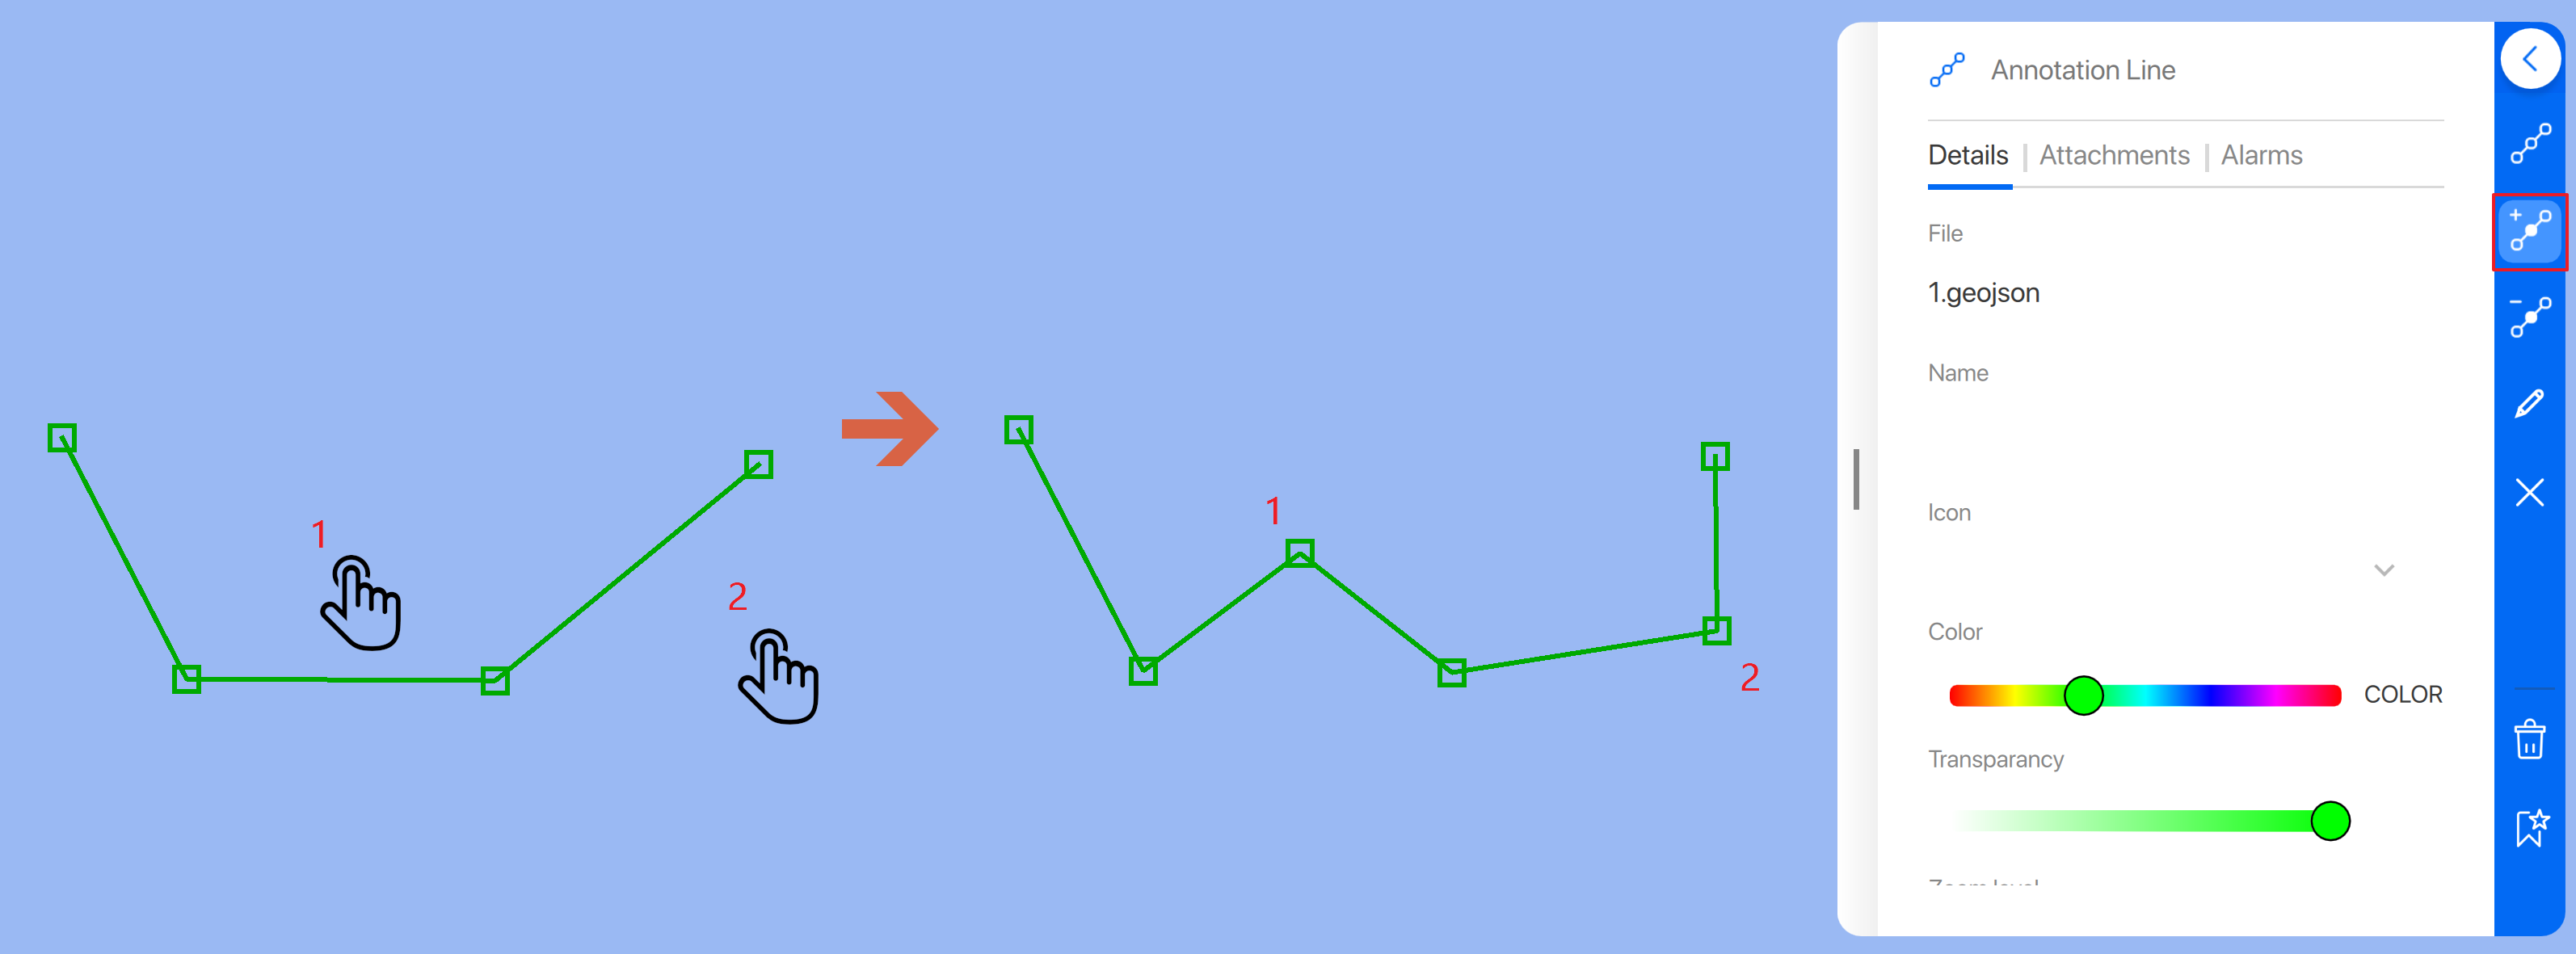
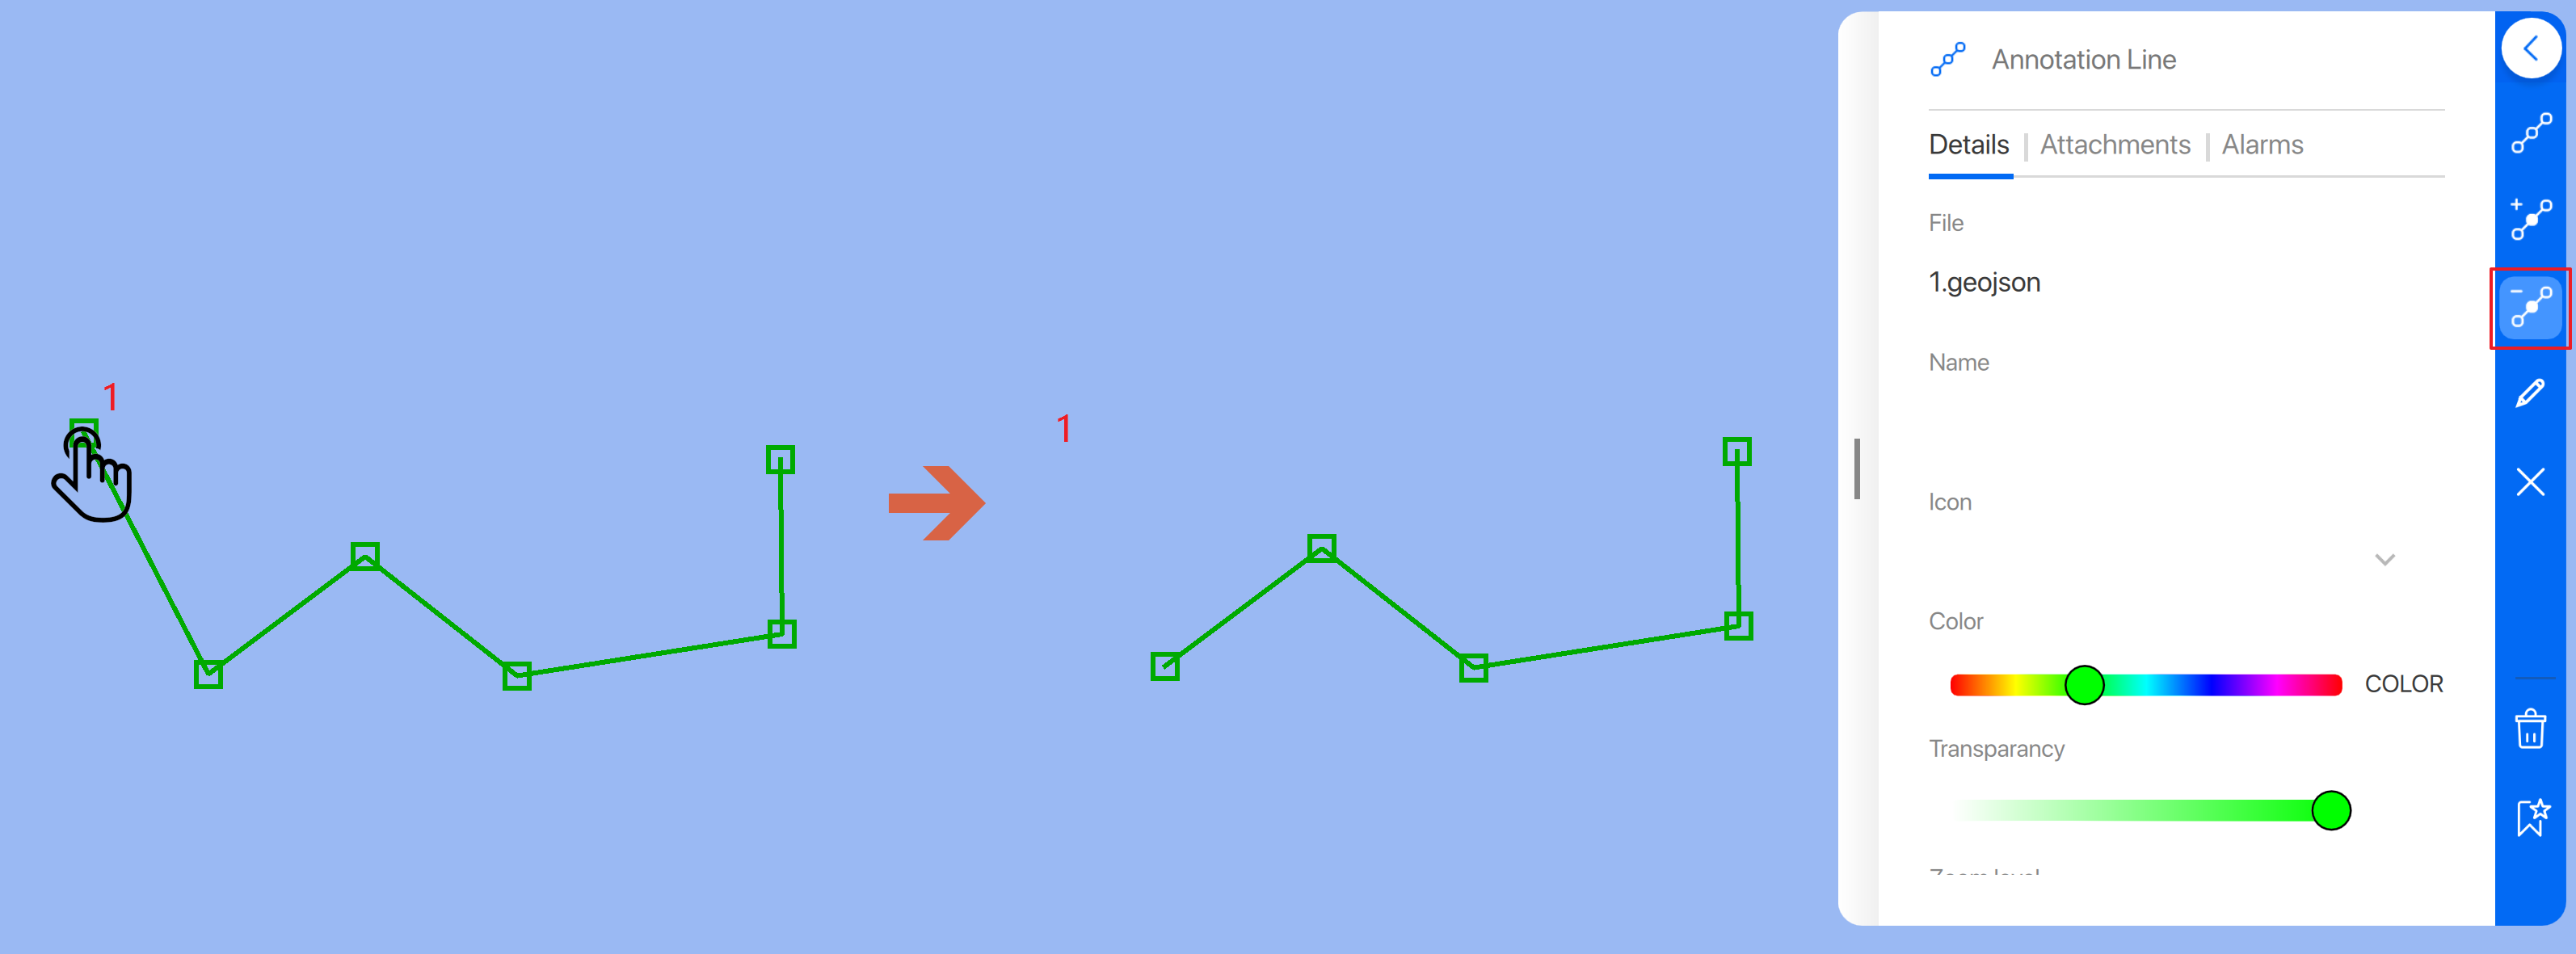
Add and delete points of a line annotation
You can add new points in between existing line pieces from the line edit menu.
Deleting a line piece
Add and delete points of an area annotation
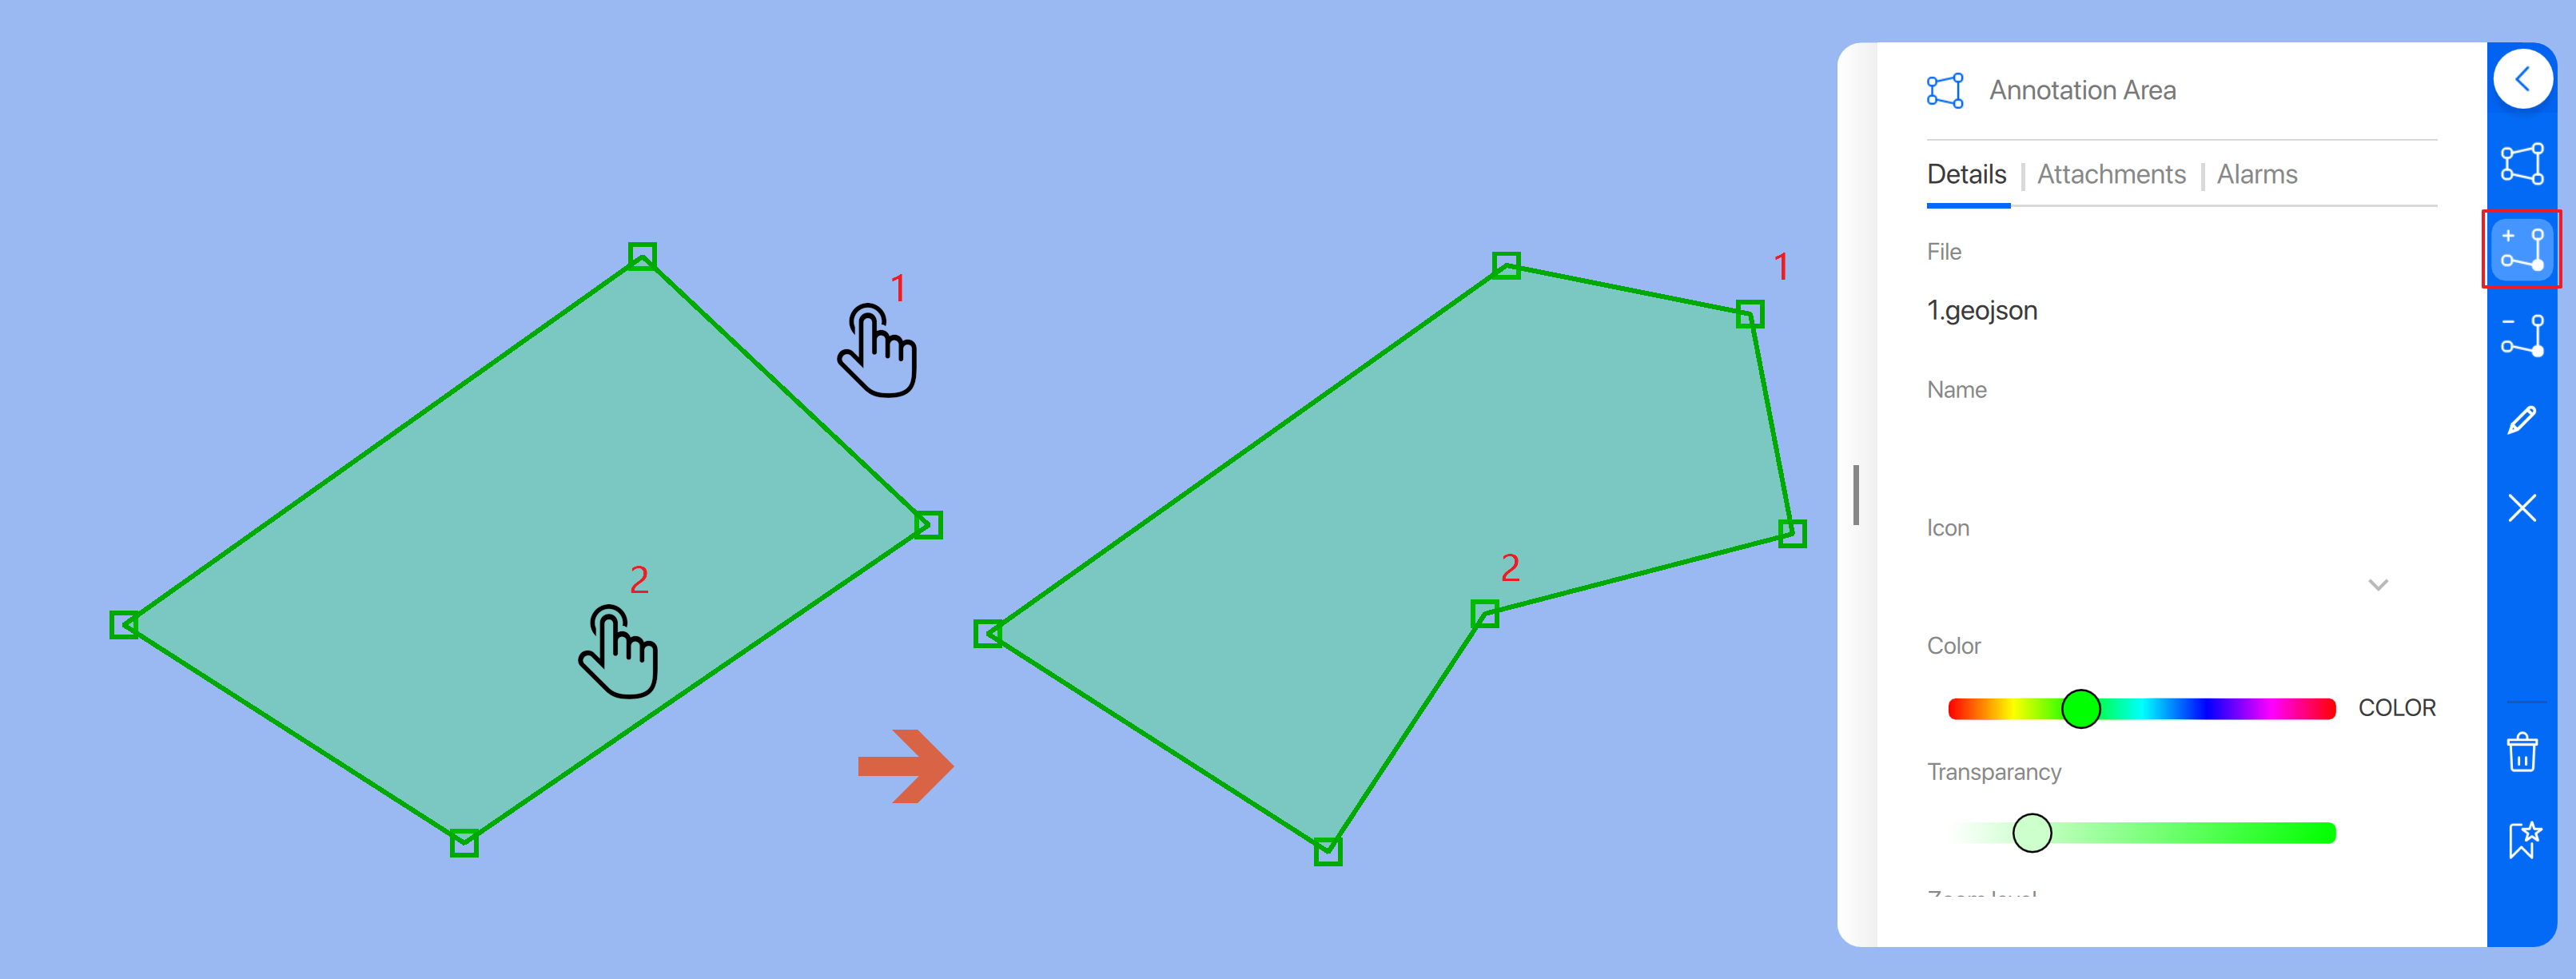
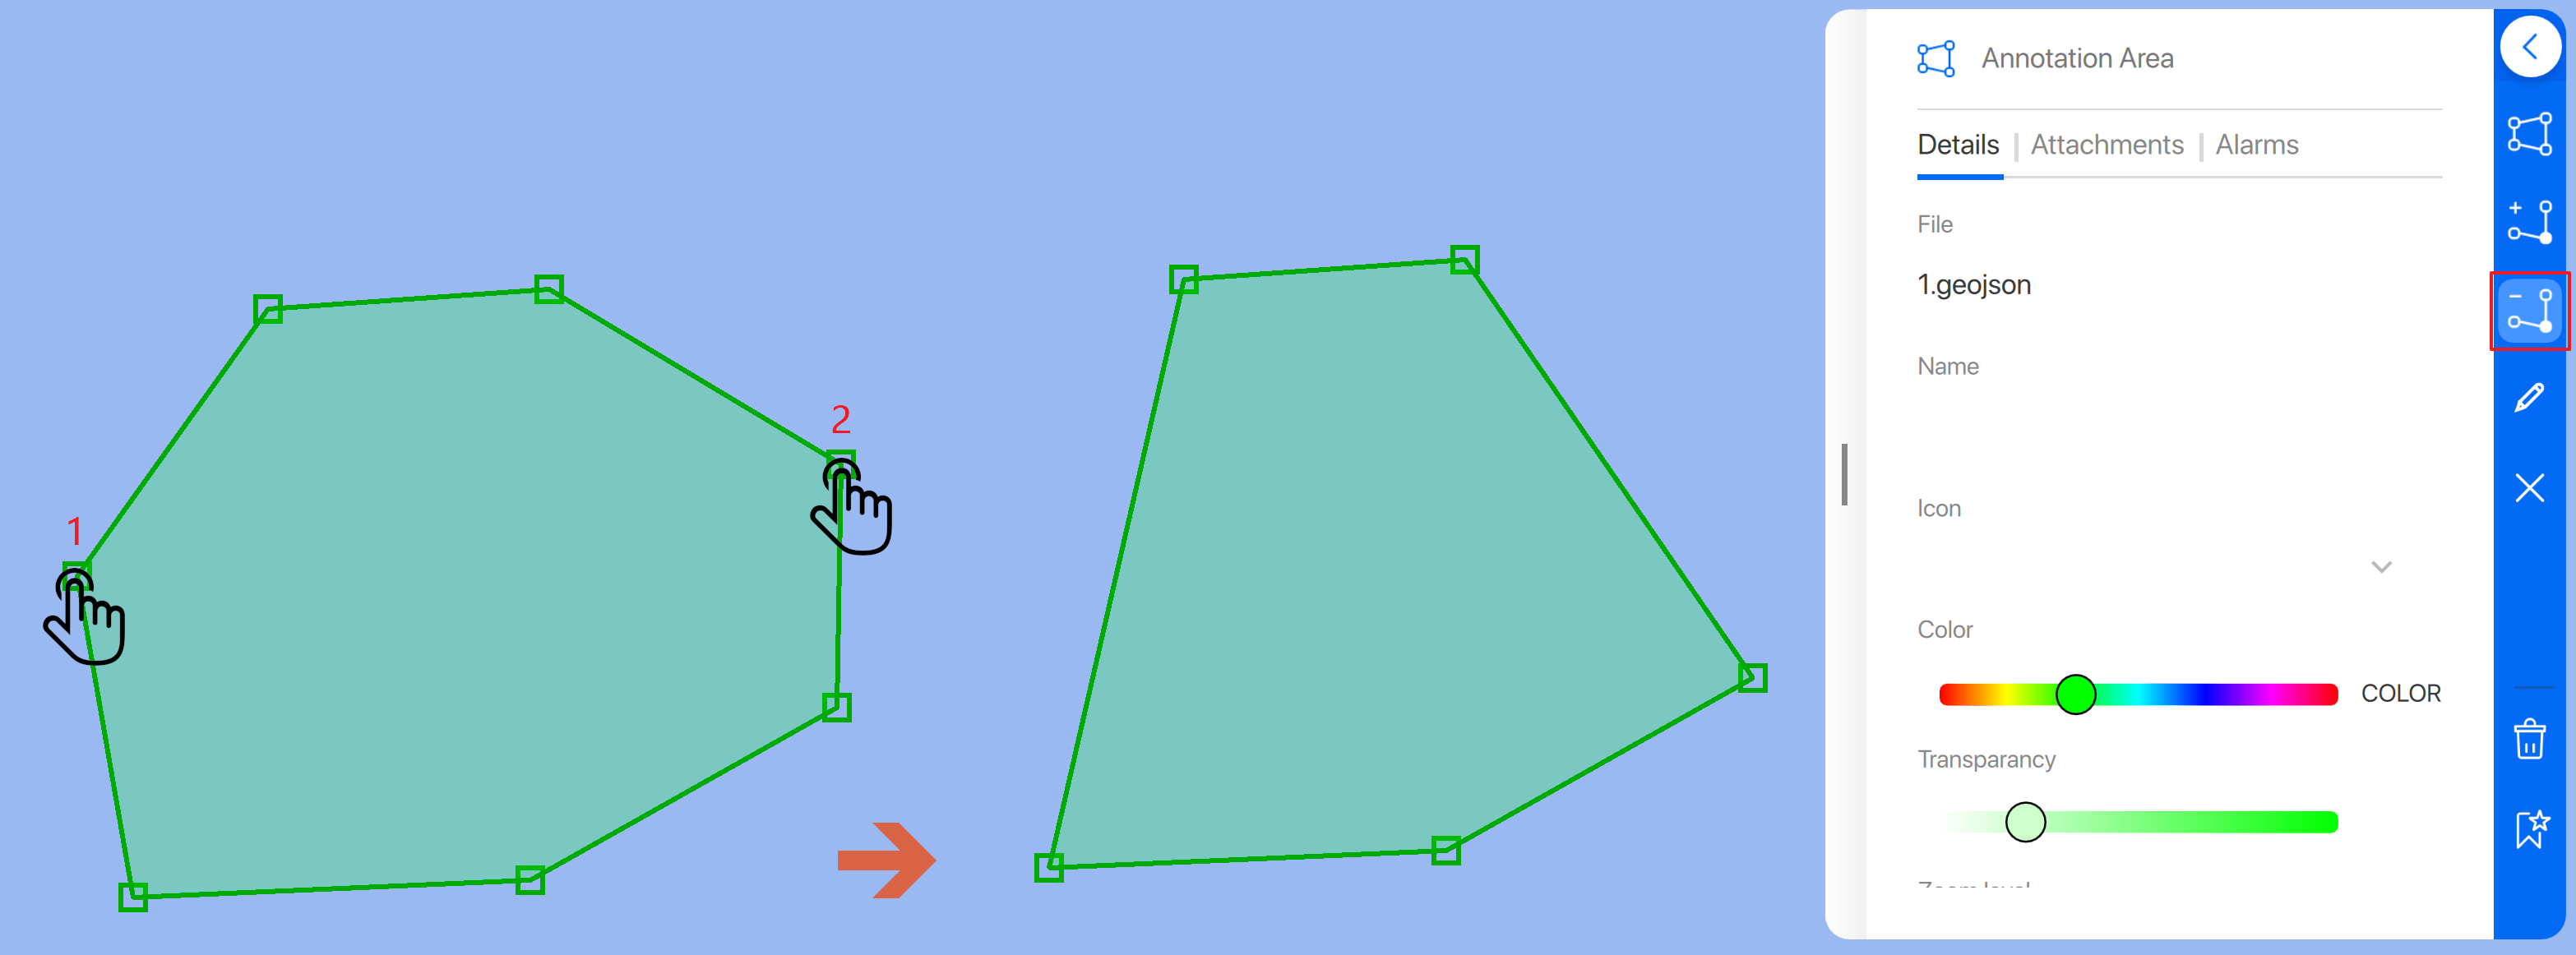
You can add new or delete existing points of an area by selecting the appropriate icons in the blue selection bar
Example adding new points
Deleting points of an area
Annotation details
File
Displays the name of the geojson the point, line or area is part of
Name
Name of the point, line or area visible in the chart
Icon
Select from a searchable dropdown list to add an icon in the chart
Color
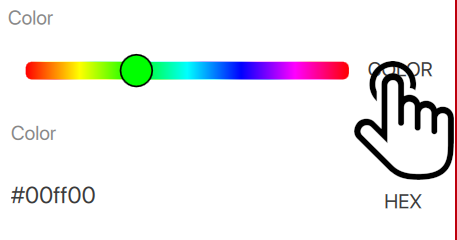
Set the color of the annotation line or area using the color slider or click on “color “ on the right side to change to apply a color using HTML color coding (#xxxxxx)
Transparency
Us the slider to set transparency of your annotation line or area
All the way to the left = 100% transparent (Invisible)
To the right = 0% transparent (Opaque)

Zoom level
Zoom levels are based on this principle used in many mapping programs
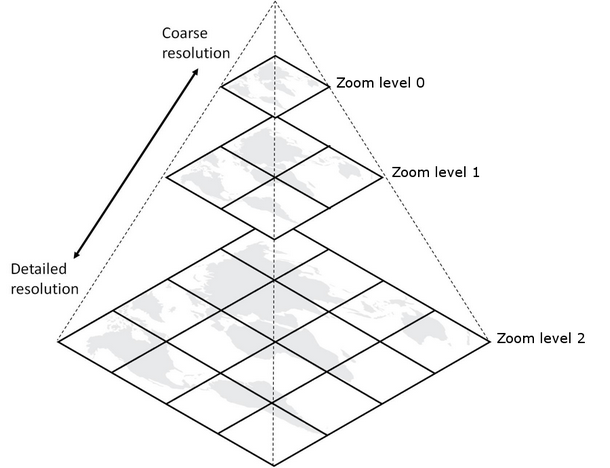
Zoom level zero is always displaying an annotation
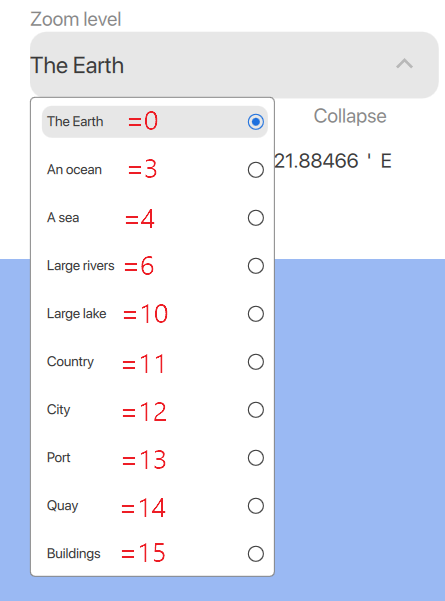
Corresponding zoom levels used in Qastor 3
Coordinates
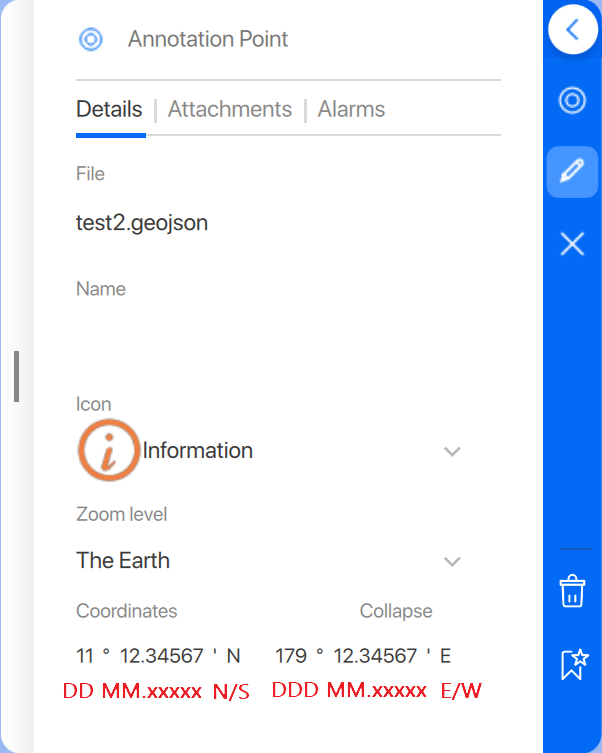
Instead of dragging an annotation point into a position on the chart it is also possible to add the coordinates numerically in format DD MM.xxxxx N/S and DDD MM.xxxxx E/W
when starting from the left the cursor will automatically jump to the next field to fill in the numbers.
Display of annotations
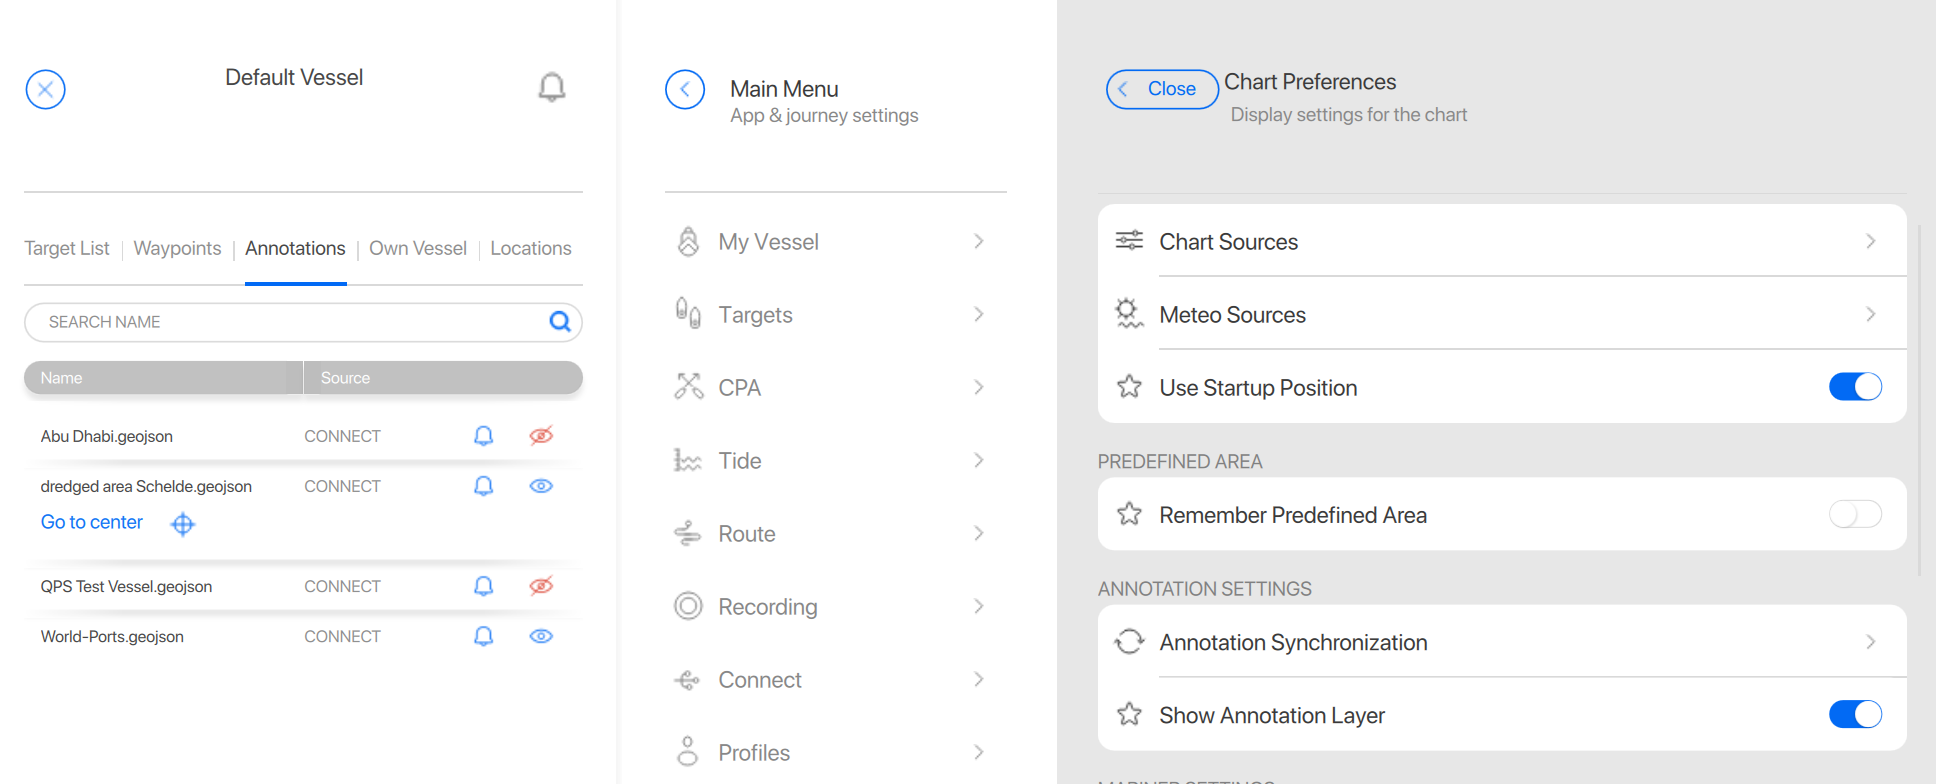
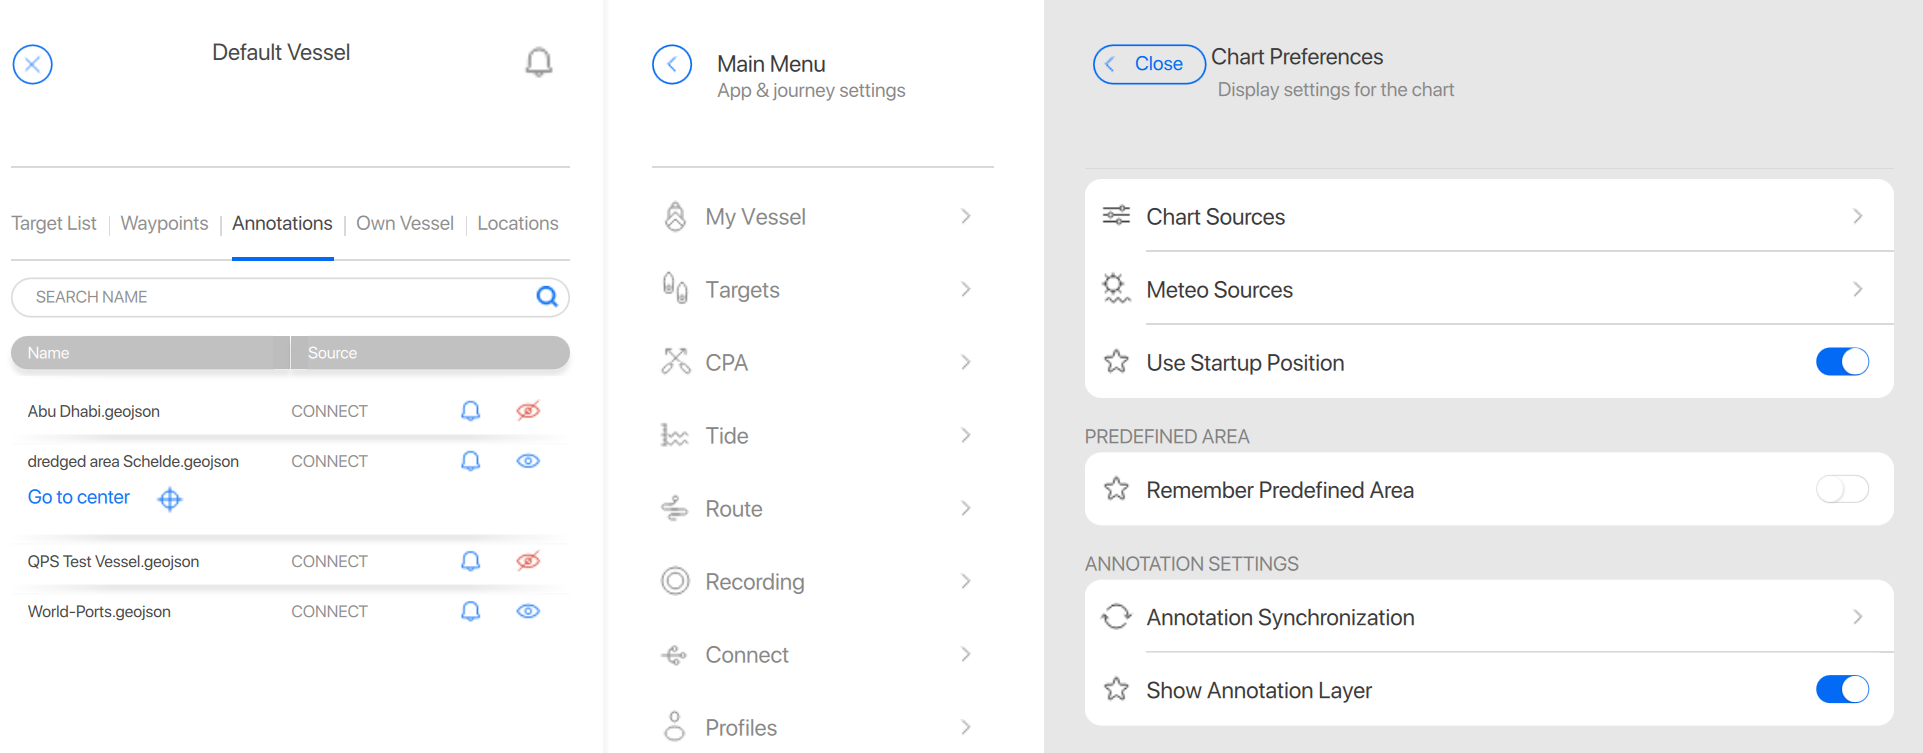
You can switch off the entire annotation layer in the Main Menu > Chart Preferences > Annotation Settings or display or hide individual annotation files from the side panel Annotations tab.
Clicking on one of the annotations provides a dropdown option option to go to the center of that annotation.
Annotation attachments and alarms
Attachments can be pictures and text files:
Supported attachment formats in iOS Qastor:
Image | Text | |
|---|---|---|
.bmp | .txt |
Windows Qastor supports all files which can be opened using a double click.
Attachments can be added and previewed from the attachment tab in the annotation editor menu.
Multiple attachments can be added to one object.
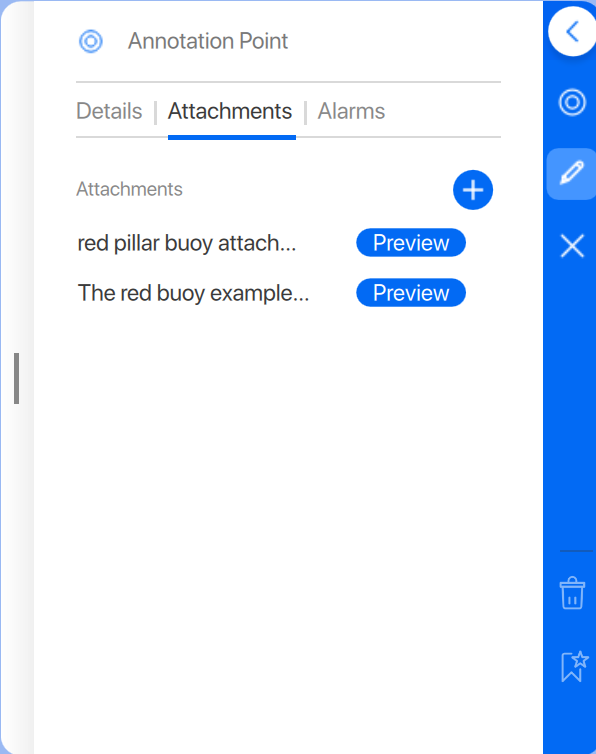
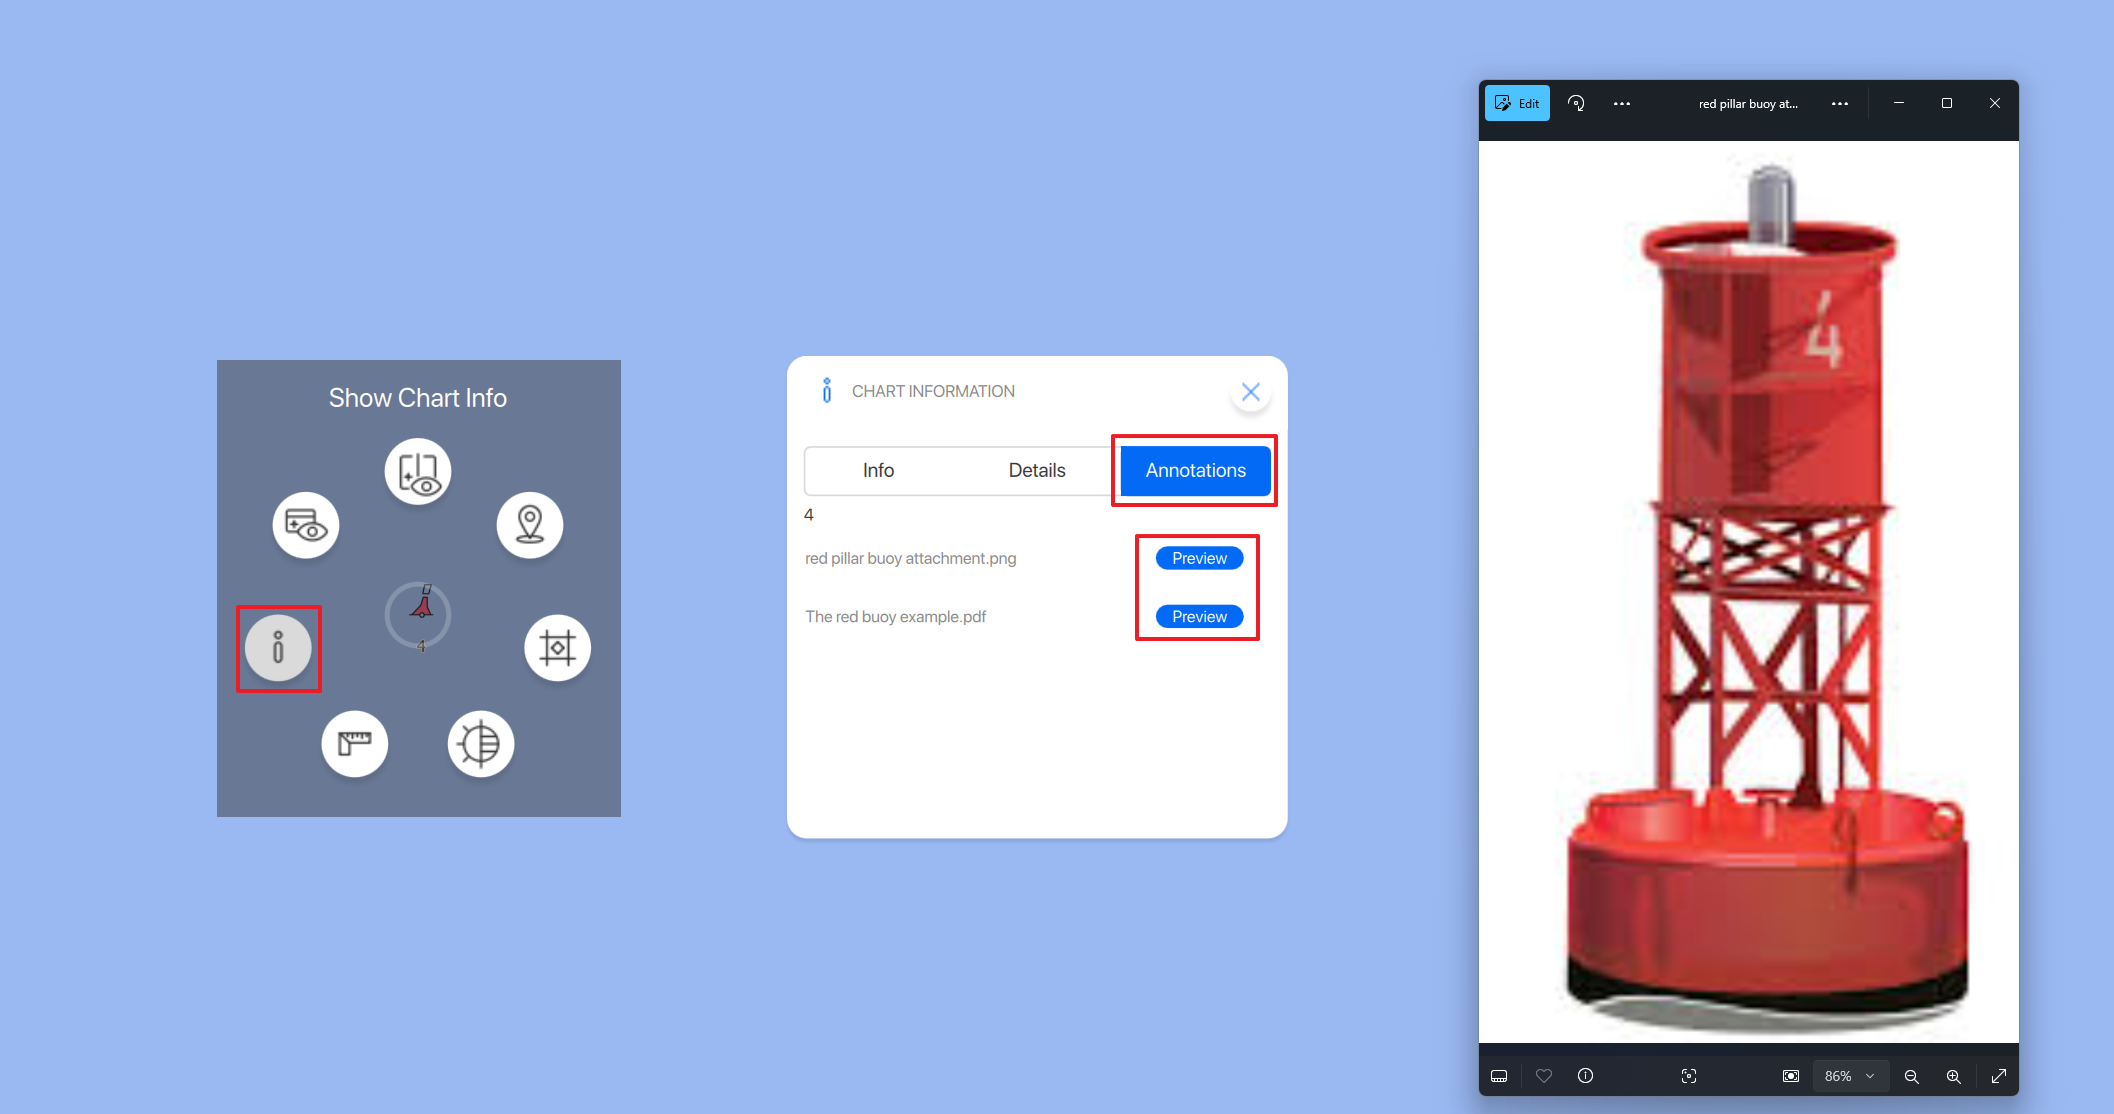
After the file is saved attachments can be viewed using a right mouse click/long press on the annotation in the chart .
This will open up a chart radial > select “i” and in the next popup tap on Annotation > Preview to visualize the annotation(s).
Deleting annotations and annotation attachments
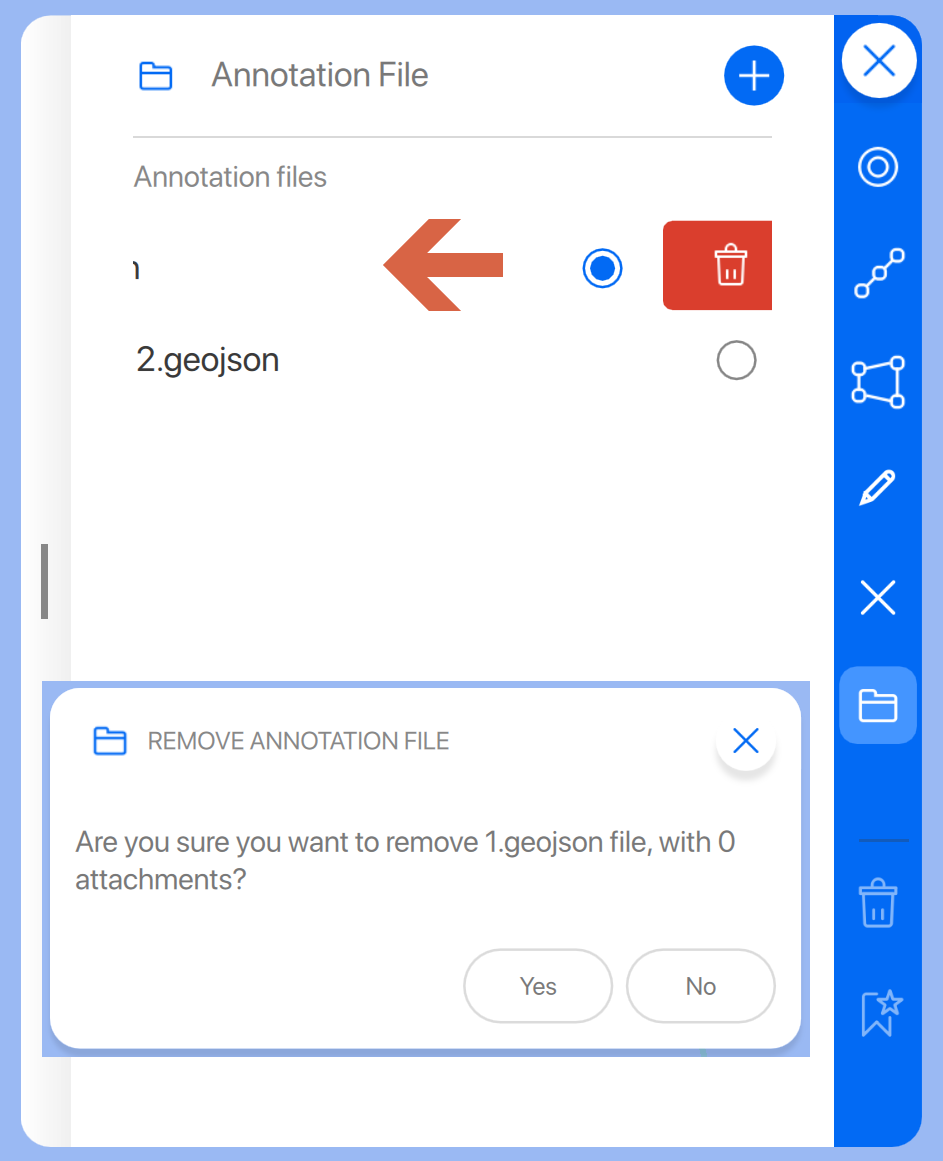
Annotations with attachments can be deleted by sliding the selected annotation in the list to the left.
This only applies to local annotation files.
Press on the delete icon on the right side after this a confirmation popup window will be displayed
Select Yes to delete the annotation file and attachments if any.
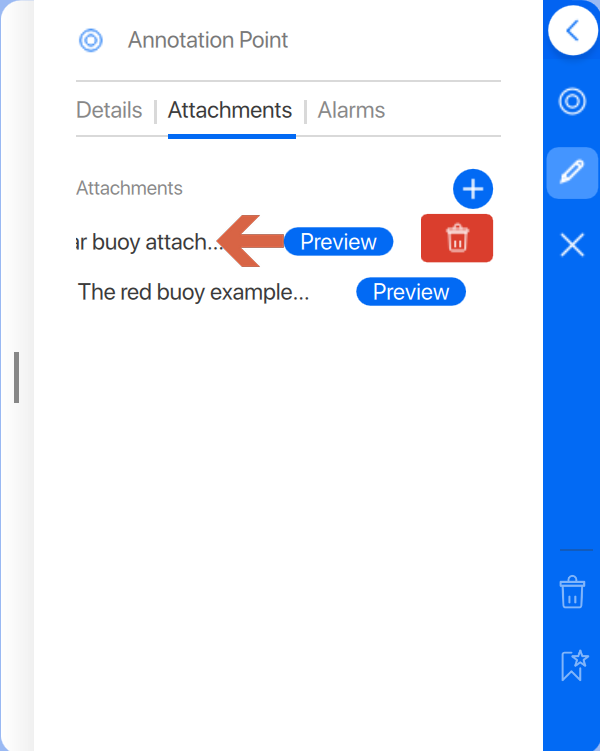
If you only want to delete an attachment from an annotation go to the attachment tab from the annotation point, line or area and slide the attachment to be deleted from right to left. Use the “bin” icon to delete the attachment. The attachment will be deleted directly without an extra popup screen.
Active annotation alarms
Annotation alarms are only applicable to areas.
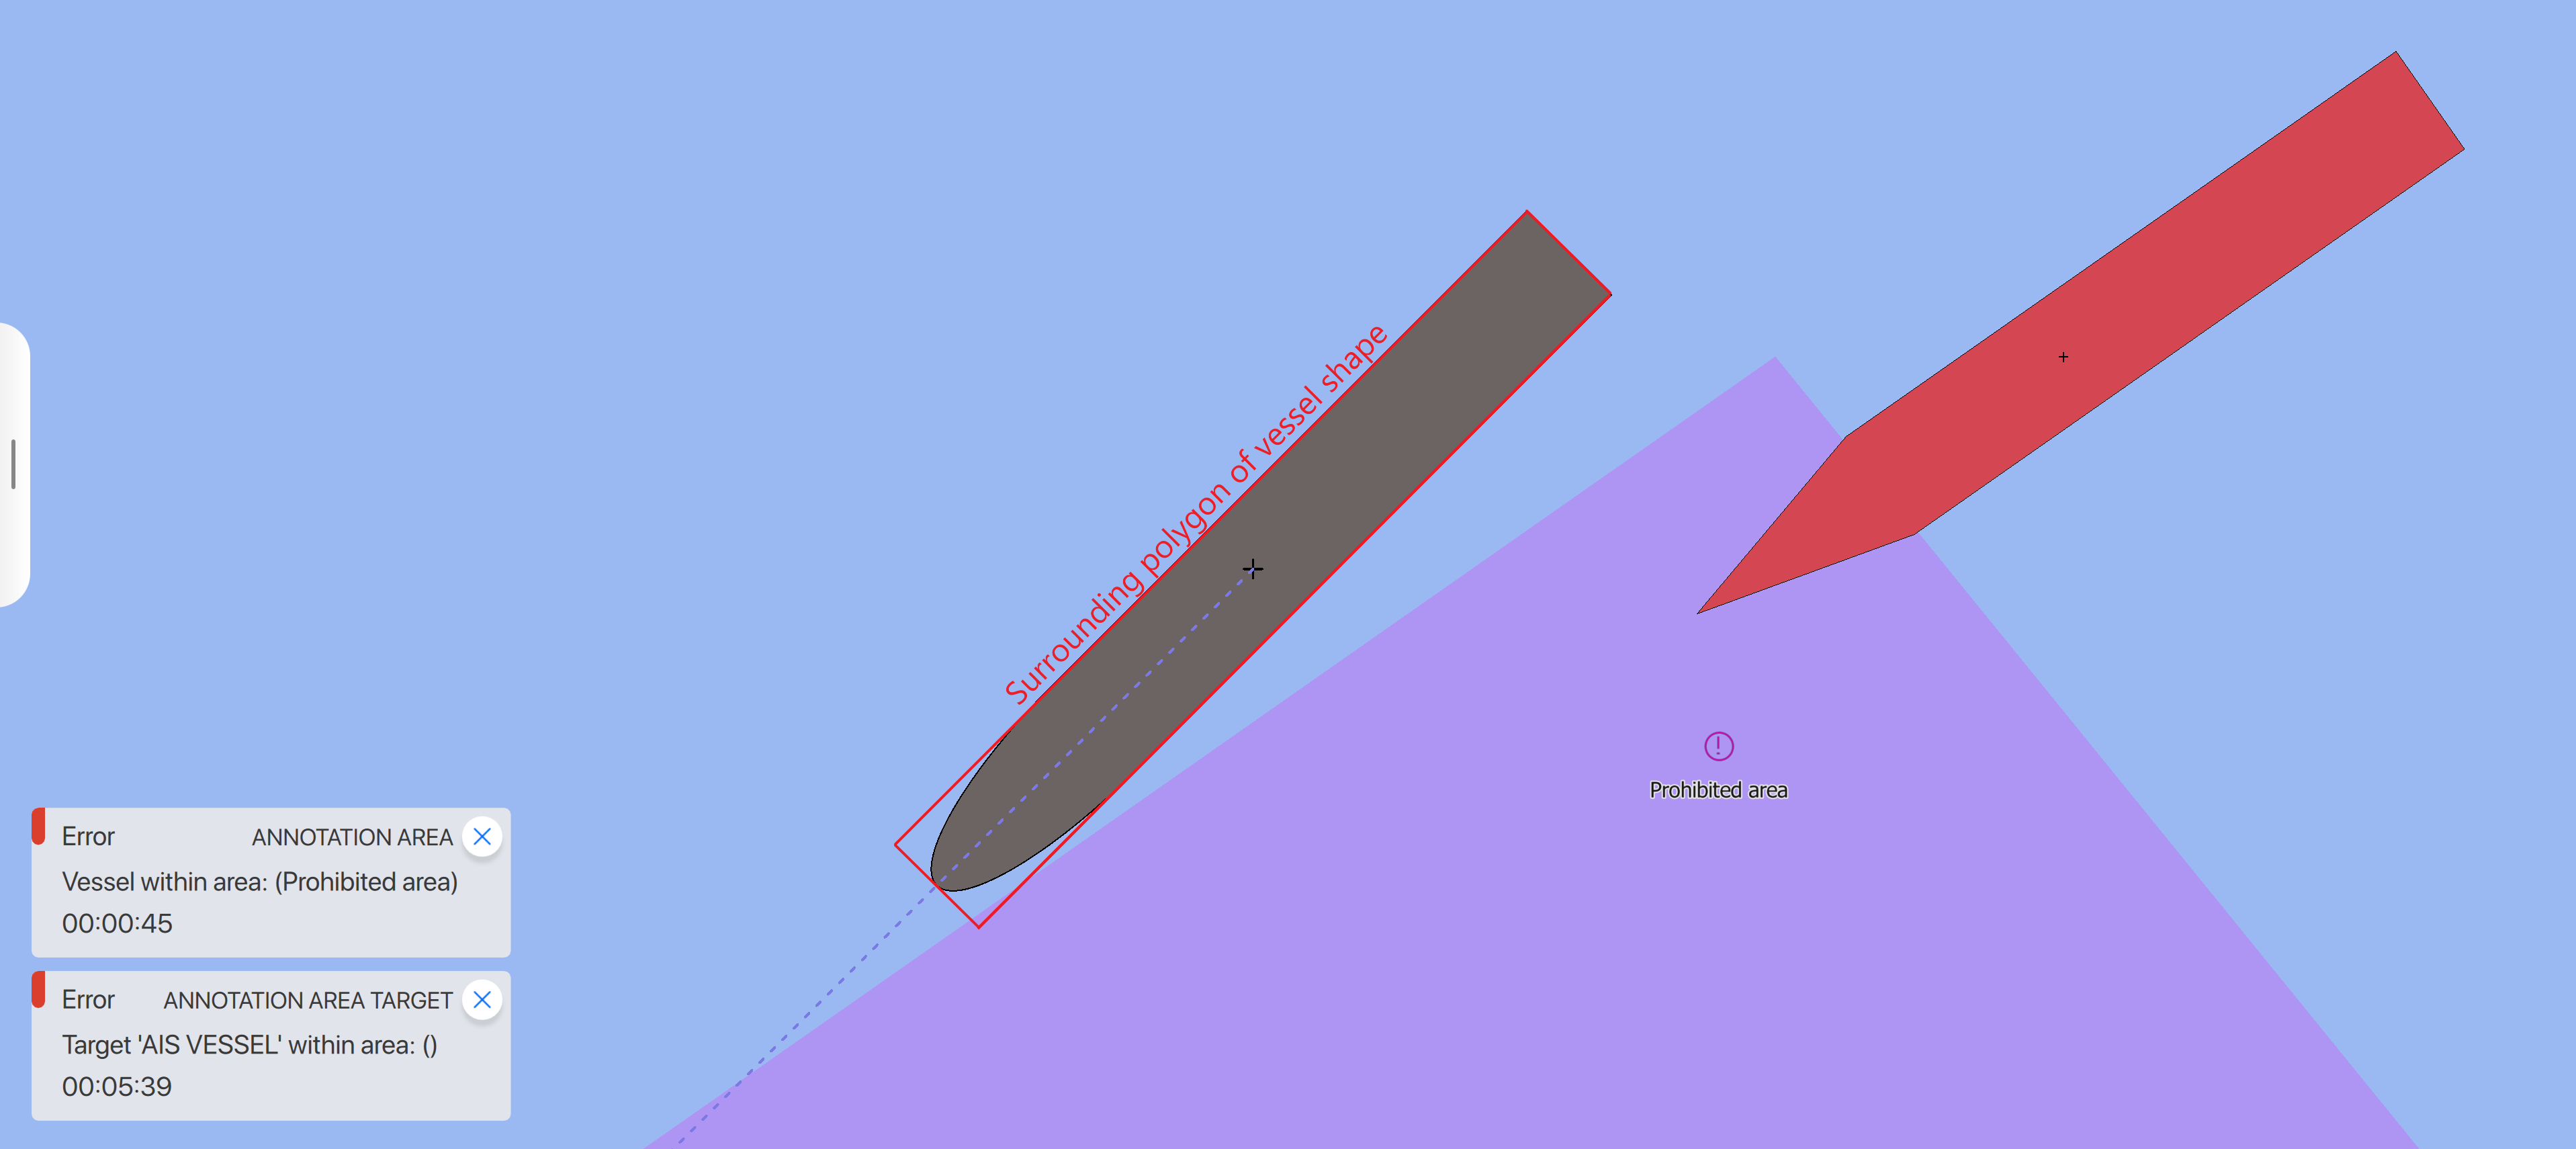
Alarms can be set for your own vessel or other vessels entering an annotation area.
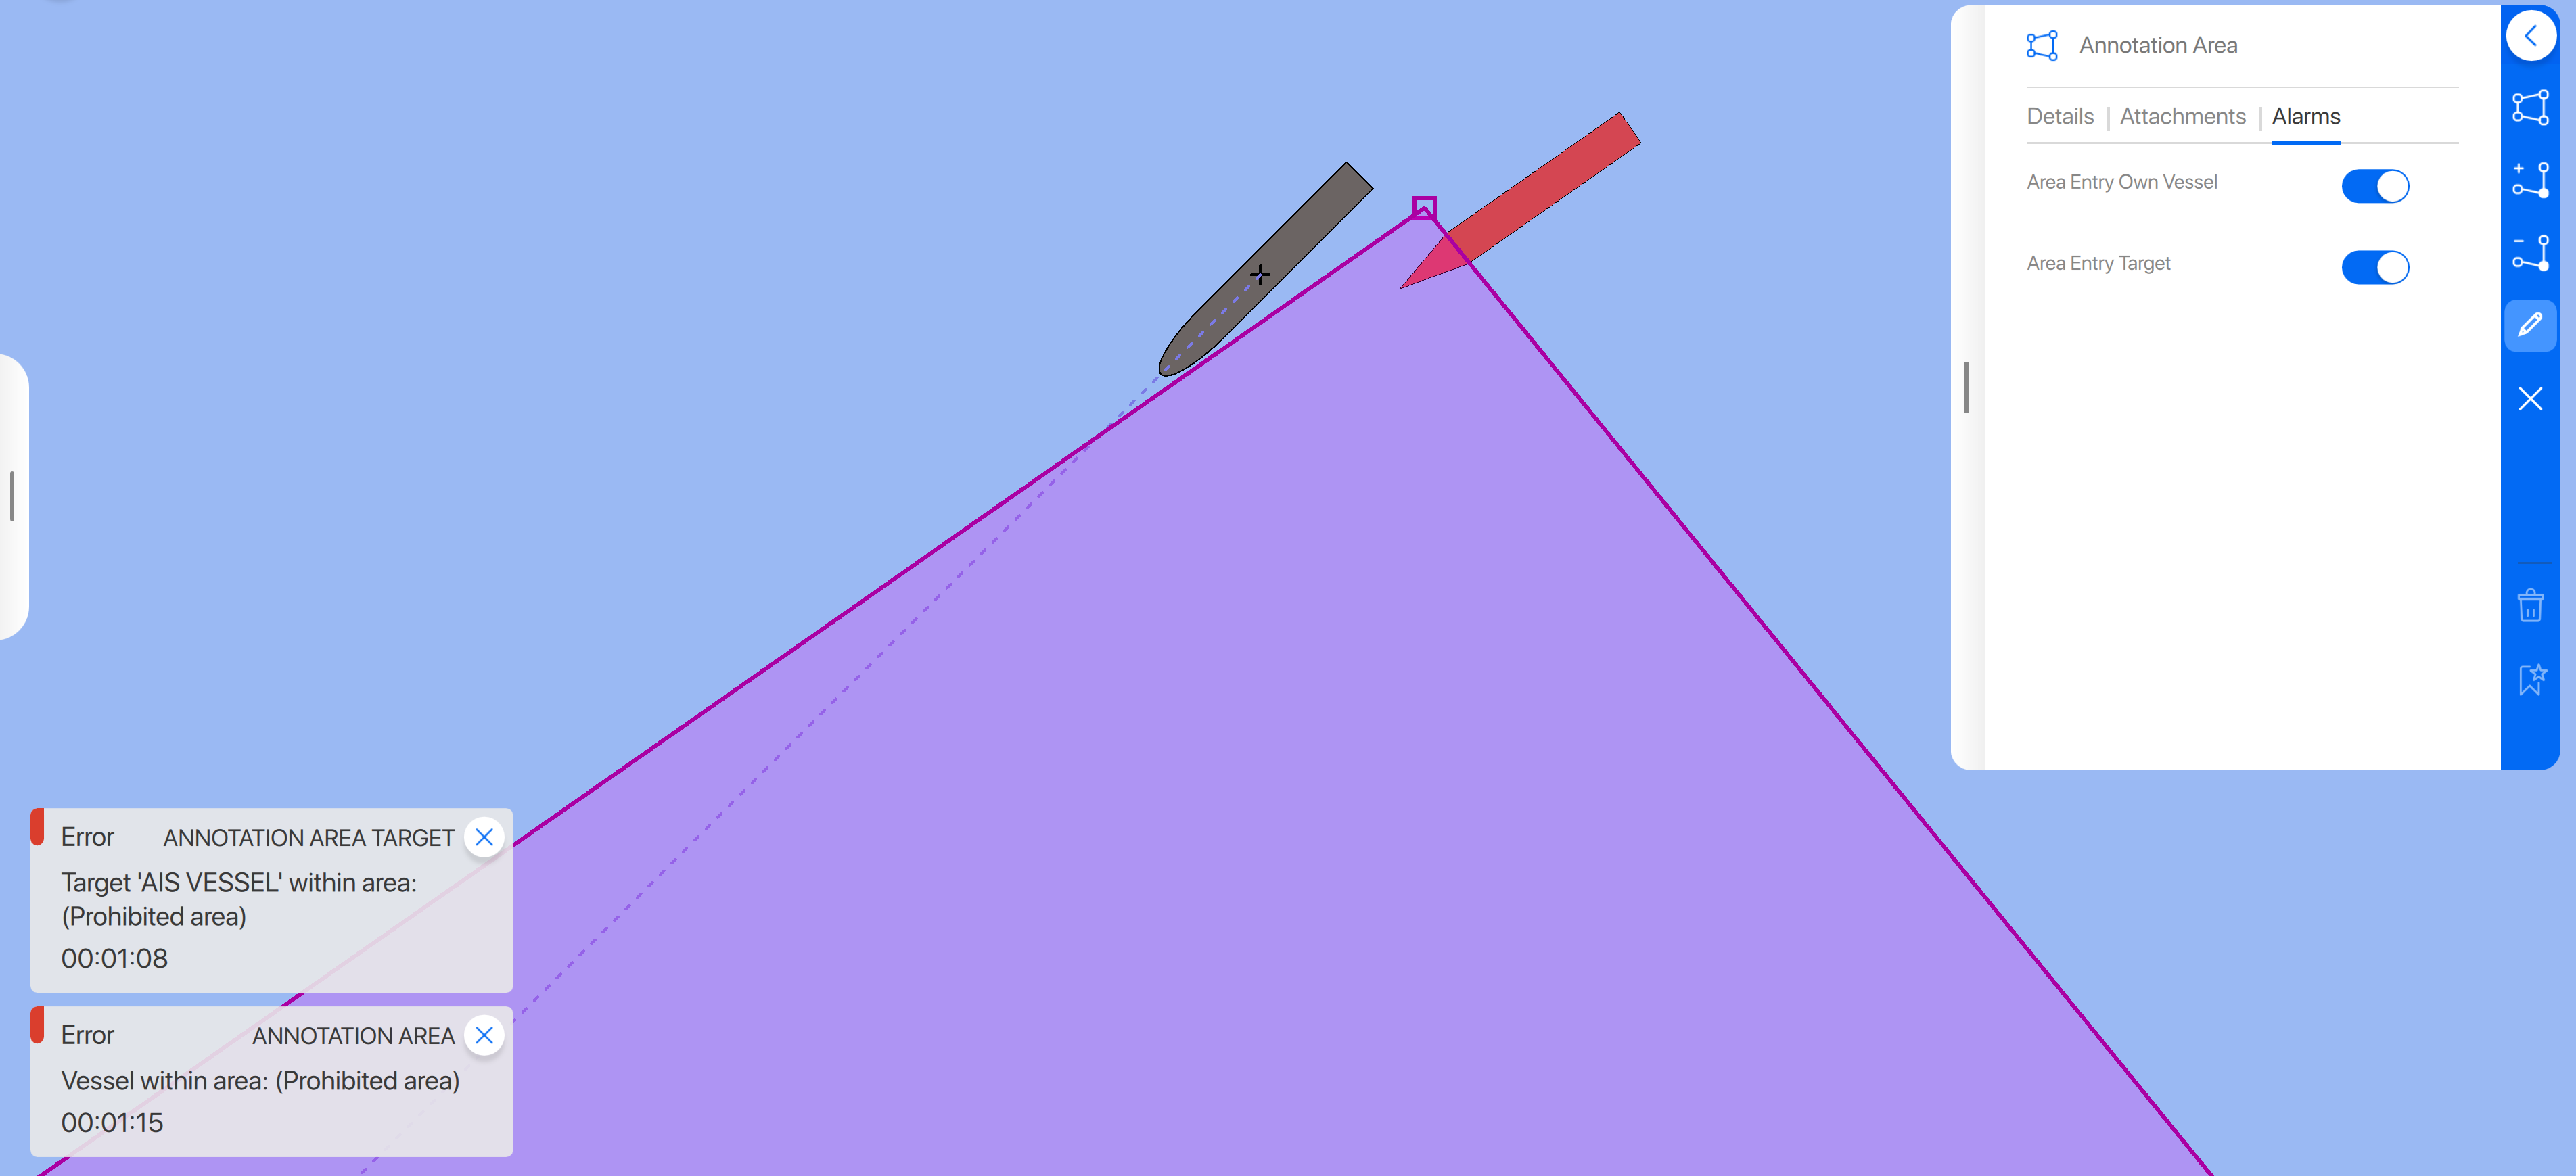
Entering annotation area alarms will be triggered when a part of the vessels “surrounding polygon” is inside the annotation area.
Connect server annotations
If a Connect server is used to distribute annotations and the correct rights are applied to you as a user you can also download these files to Qastor.
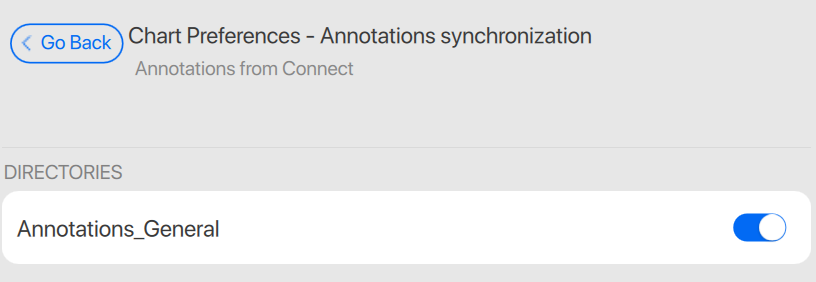
Goto Main Menu > Chart Preferences Annotation Synchronization
In the next page open Manage Directories
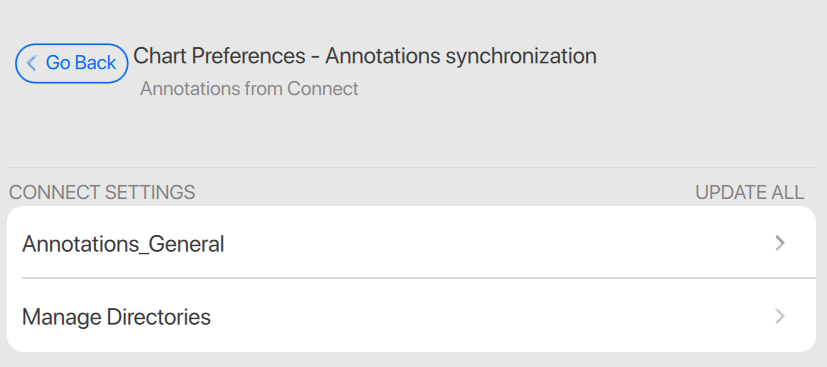
Select which annotation folder(s) you want to synchronize
You can see in the annotation list in the side panel if a file is from a Connect server or a local one.
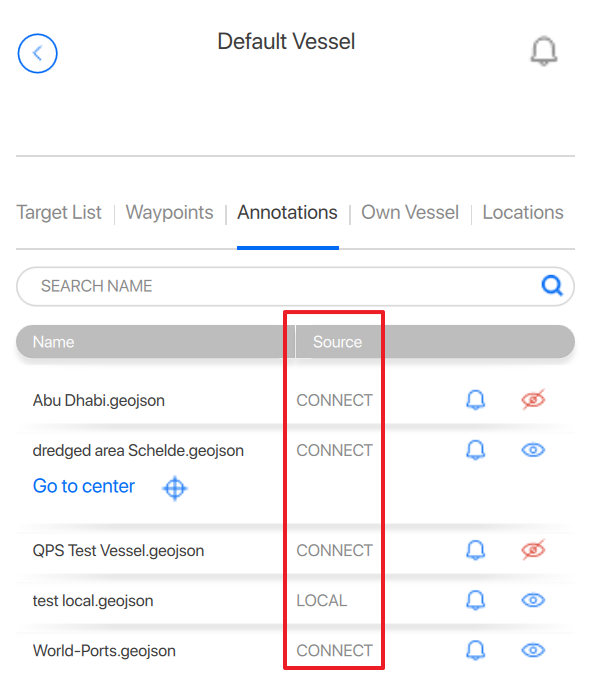
Example data can be found on the Default Connect server available for all Qastor 3 versions.
Extra info
Annotations files from third-party sources:
Have to be added to:
Windows folder: C:\Users\your username\Documents\Qastor\My Annotations
iOS/iPADOS: On My iPHONE/iPAD/Qastor/My Annotations
According to the geojson specification (RFC-7946)
Should have extension .geojson
Should be in WGS84 Lat/Lon format
An island or hole (Area in an area) are not displayed in Qastor
Does not cross the antimeridian (Complement is shown)
Should contain correct features for lines/areas and points:
Points: marker-symbol, min-zoom (name)
Line: stroke, stroke-opacity and min-zoom (name)
Area: fill, fill-opacity and min-zoom (name)
(no zoom set = zoom level 0 always visible)
