3D Geometric Classes
The 3D Geometric Classes in Fledermaus include ways to display vector data such as points, lines and polygons, as well as options to display structure and object models.
3D Point Class
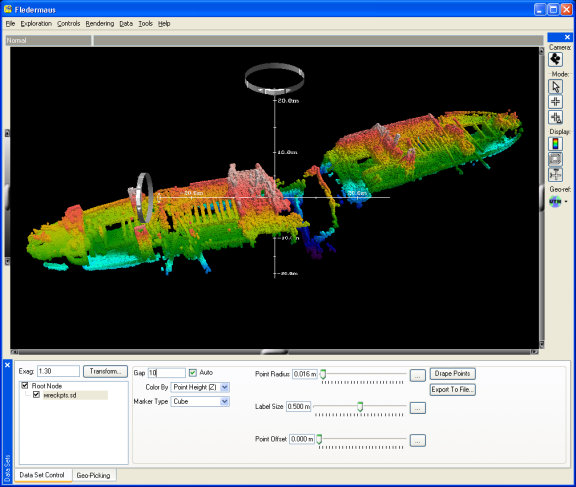
Figure 1 14 - Sample 3D Points
The 3D Point class is capable of visualizing 2D and 3D point data with optional labels attached. This class serves a variety of purposes, from labeling points of interest in a 3D scene, to displaying a large point surface. Sometimes looking at the individual measurements is more useful than viewing a gridded surface of these points. The much more complex classes such as the PFM processing class also make use of points to display their information; however, they provide much more associated functionality including editing and on the fly surface generation.
3D points can be imported into Fledermaus using the File > Import > Import Points menu command or the mkpoint3d command line program.

Figure 1 15 - 3D Point Controls

Figure 1 16 - 3D Point Color By Options
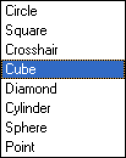
Figure 1 17 - 3D Point Marker Type Options
The controls for a 3D Point object are shown in Figure 115. The Gap text field is used to decrease the number of points drawn when exploring the data. For example, when using a gap value of 2, every second point is displayed. If the Auto toggle is enabled, the ShiftScapeTM rendering engine will automatically choose the best point gap based on the speed of your hardware. The Drape Points button is used to drop points vertically until they lie on the surface below. The color-coding of the points can be selected from the Color By menu, shown in Figure 116. Options include coloring by a Solid Color, the Z coordinate of the points (Point Height), or an additional Attribute. Thus the color information of a point can provide an additional dimension of information. When Solid Color is selected from the list, the color can be selected using the Standard Color Picker Dialog. The Marker Type pop-up menu, shown in Figure 117, allows a different symbol to be displayed for the points. The choices currently include squares, circles, crosshairs, cubes, diamonds, cylinders, spheres, and points.
Three sliders located at the center of the panel also control how the points are drawn. The size of the points can be adjusted by dragging the Point Radius slider. All points can be offset vertically a small amount by adjusting the Point Offset slider. Some point files have labels attached to particular points and the size of these labels can be controlled using the Label Size slider. An exact value can be entered by typing a value in the textfield to the left of each slider. Also, by clicking the "…" button to the right of the slider, the starting value, current value, and ending value for the slider can be specified.
New for version 7.7.0, the precision of numeric labels displayed may be controlled by the Label Precision slider. This affects the display only. It does not change the precision of the stored data. The precision set applies to any field selected with numeric data. String data and labels are unaffected, even if they contain a numeric value. The default is 9 places after the decimal, as in previous versions. The precision is saved when the object or scene is saved
Since Fledermaus version 7.6.0, the time attribute may be controlled by the options in the Time Visibility panel on the right hand side. By default, the time attribute of the data is ignored. This differs from previous versions which used the time attribute by default. Time can be applied to the data using a time window, which is the period of time through which points will be displayed. There are two options for the time window, a dynamic window from minimum time and a static time window of specified size in seconds. The dynamic iwndow stretches from the start of the time bounds up to the current time. As time increases or decreases, the dynamic time window will stretch or shrink to fit, respectively. The static time window is by default 10 seconds in length, though this can be changed as you wish. The static time window will show the data at the current time that fits within the static window of time. Experimenting with the controls and the time bar will show how easy this is to use; the data is not changed by these settings, only what is displayed in the scene.
3D Line/Polygon Class
The 3D Line class is used to represent information that has been broken down into 2D and 3D lines. Lines of this class are actually polylines and can consist of any number of line segments. Polygons can also be represented in this SD class by marking the polylines as closed. Thus lines, polylines, and polygons can all be represented in the same object.
Many of the converters such as those that read ArcView shape files or DXF files will tend to produce this type of visual object. Line objects can also be created using the File > Import > Import Lines menu command or the mklines command line applet.

Figure 1 18 - 3D Line Controls

Figure 1 19 - 3D Line Color By Menu
Figure 118 shows the available controls for the 3D Line class. The thickness of the lines is specified by entering a value in the Line Width text field and pressing Enter. The Gap text field is similar to the gap for the points class and controls how much the line class is degraded. The ShiftScapeTM rendering engine will automatically set the gap if the Auto toggle is enabled. There are three options for coloring a 3D line file, as shown in Figure 119. Selecting Solid Color will display all lines as a single color. The color can be choosing by clicking the Change Color button and selecting a color using the Standard Color Picker Dialog. The Line Height option will color a line based on its height. If an attribute is attached to the file, the lines can be colored by attribute by selecting the Attribute option. The Interpret Closed Polygons as Filled toggle draws the lines as filled polygons. Note this toggle only has an effect if the original SD file was built using the -poly flag in mklines or a polygon ESRI shape file was imported.
The controls in the Line Height box allow the z values of the points in the lines to be controlled. The Offset slider can be used to move the lines slightly above the surface and is useful if lines are lying directly on a surface. The Drape Lines button will drop all vertices of the lines until they lay on the surface below. The Set Heights button will display a dialog as shown in Figure 120. Enter a value in the dialog and press OK to set all lines in the object to a specific height.

Figure 1 20 - Setting Line Heights
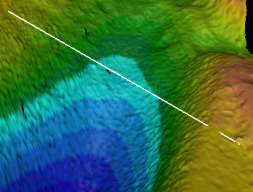
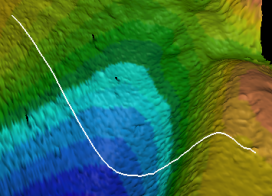
One limitation of the Drape command is that it only drapes the vertices of the line on the surface. Therefore, if the line does not contain many vertices, it will only be partially touching the surface. The solution is to resample the line before draping using the Resample and Drape button. This command will display a dialog as shown in Figure 121 that is used to input the resampling interval. New vertices will be added to the line based on this interval. For example, a value of 5 means that a new vertex will be added every 5 meters along the line. The result of the Drape command and the Resample and Drape command for the same line can be seen in Figure 122(a) and Figure 122(b) respectively. Note the units of this dialog are based on the units of the current data. If the object is using geographic coordinates, than an interval of decimal degrees should be specified.

Figure 1 21 - Resampling and Draping Lines
|
|
Figure 1 22 - Difference between Drape and Resample and Drape
The current line object can be dynamically edited using the options in the Edit box. Clicking the Add Polygon Selection button adds the current polygon selection to the line object. See the Polygon Selection Mode section in Fledermaus for more information. The Delete Last button removes the last line that was added. All lines can be deleted by clicking the Clear All button. The current line object can be exported to an ASCII XYZ file by clicking the Export XYZ button and selecting an output file in the resulting file selection dialog.
New for Fledermaus 7.7 is the Export to 3D PDF button that will export the lines as a 3D PDF or PRC file. The PDF file generated may be loaded in 3D PDF compatible readers, including Adobe Acrobat Reader.
3D Grid Class
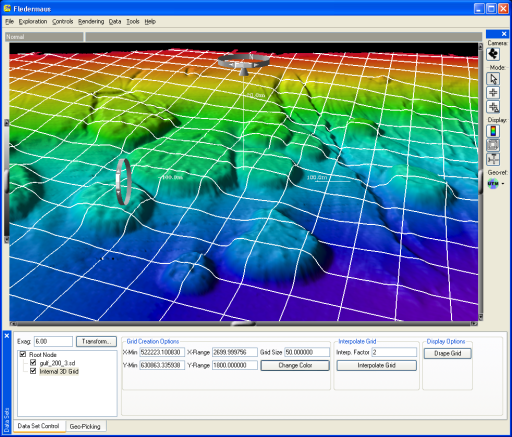
Figure 1 23 - 3D Grid and SonarDTM
The 3D Grid class allows for a variable sized 3D grid to be added to a Fledermaus scene. To do this, Add 3D Grid is selected from the Data menu and this will add an Internal 3D Grid object to the current scene (see Figure 123). The default bounds of the 3D grid are based on the root node bounds and 100 meter spacing. The following parameters can be changed for any 3D Grid object:
- X and Y minimum value,
- X and Y range,
- Grid size, and
- Grid color,
- Once the size of the grid has been defined, click the Drape Grid button to drape the grid onto the surface. If the surface is very rough, the grid may not match the landscape exactly. For a better approximation, the grid can be subdivided by adjusting the Interp Factor and clicking the Interpolate Grid button. The higher the interpolation factor, the better the grid will match the surface. Even when interpolated, the lines may not be drawn correctly since both the lines and the surface lie at the same height. To raise the lines slightly above the surface, use the Transform dialog accessed by clicking the Transform button. Figure 123 shows a SonarDTM with a 3D grid loaded and draped on the surface with 50 meter spacing. The 3D Grid controls are shown in Figure 124.

Figure 1 24 - 3D Grid Controls
Data Table
The data table is a component of the previous classes, composed of lines and points, that shows the data contained by the object. For points, the actual data for each point is visible and can be examined a group at a time. The controls at the top left can be used to scroll through each group of points. The size of each group can be set with the Rows in Table field. Any point can be found in the scene by clicking on the marker button (red flag). Lines only list the line number, the data for the lines is not currently available. New in 7.7.0 is the drop down widget at the far right, circled in blue. This widget lists a menu of actions that be done on the table. Currently, the only option is to save the table in CSV format. Two controls to the left of this widget allow manually deleting points from the object and adding new points to the object.
New for Fledermaus 7.7.0, the headings in the data table may also be changed. Simply right-click on the header to be changed, see Figure 1.26, and the attribute name may then be edited. Both points and lines may be edited this way. Beware that X, Y and Z columns should not be renamed.

Figure 1.25 - Data Table
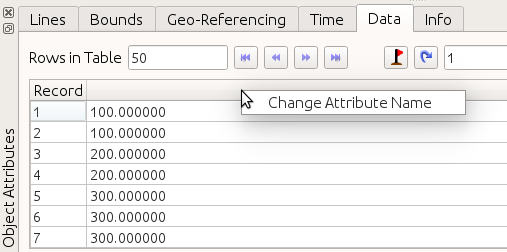
Figure 1.26 - Rename Field in Data Table
Solid Model Class
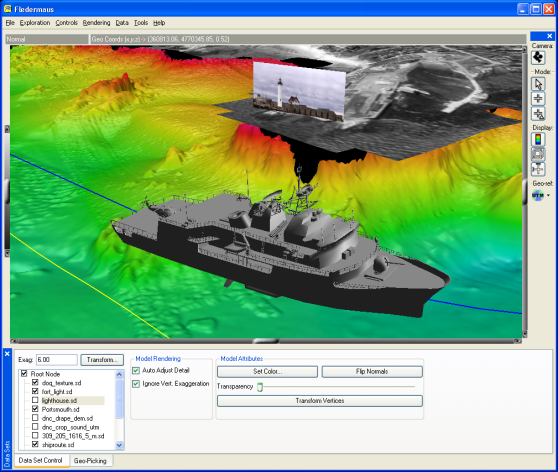
Figure 1 27 - Sample Solid Model
A Solid Model is a three dimensional object in a scene consisting of a number of polygons. Solid Models might represent ships, drilling platforms, bridges, etc. Currently Solid Models can be loaded in Fledermaus using the File > Import > Import Model menu option or through the mksolid command line program. Both 3DS and Wavefront OBJ files are supported. Figure 1.27 shows the results after the addition of a model and Figure 1.28 shows the Solid Model controls.
When enabled, the Auto Adjust Detail toggle notifies the ShiftScapeTM rendering engine to automatically adjust the number of polygons drawn depending upon your graphics hardware. When the Ignore Vert. Exaggeration toggle is enabled, the model is drawn the same height regardless of the exaggeration of the scene. This option is useful for ships, subs, or other objects in the scene that should not be stretched when the vertical exaggeration is changed.
The color of the model can be controlled by clicking the Set Color button and selecting a color using the Standard Color Picker. Note that if a model originally contained many colors, all colors will be overwritten with the indicated color. Some programs may output polygons with vertices in the wrong order, which will result in the lighting calculations on the model being incorrect. Clicking the Flip Normals button will attempt to correct this problem and clicking the Flip Normals button again will undo the operation. The transparency of the model can be controlled by dragging the Transparency slider. Note that the lighting direction can be changed by selecting the Controls > Light Sources menu option.

Figure 1 28 - Solid Model Controls
To change the position of a model after it has been added to the scene, alter the geo-referencing coordinates by clicking on the Transform button or the Controls > Geo-Referencing menu option. Alternately, the model can be transformed by clicking the Transform Vertices button, which displays the Transform Vertices dialog as shown in Figure 1.29.
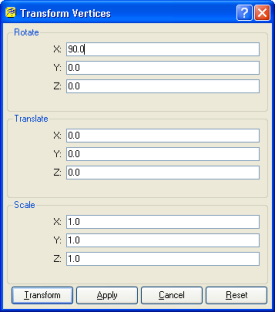
Figure 1 29 - Transform Vertices of a Solid Model
The Transform Vertices dialog can be used to rotate, translate, or scale the vertices of a solid model. Note that this operation is different than using the Transform button in the Data Set Controls because this transformation permanently modifies the vertices. The model can be rotated around the X, Y, or Z axes using the Rotate text fields, moved to a new location using the Translate text fields, or resized using the Scale text fields. Click the Transform button to apply the changes and close the dialog, or the Apply button to transform the vertices without closing the dialog. Click the Cancel button to close the dialog without making any changes, or the Reset button to return all of the fields to their original values. Note that any rotations will take place before any translations and any translations will take place before any scaling. In general, it is easier to use this dialog to only apply either a rotation, translation, or scale at a time. In this case, make sure the Reset button is pressed after each transformation is performed.
Return to: Reference Manual

